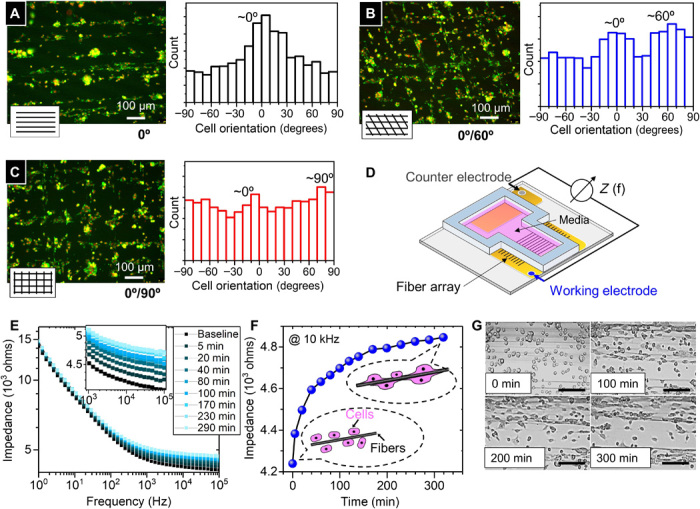
Fig. 5. PEDOT:PSS fibers bioimpedimetric sensor.

(A to C) Fluorescence images (red, nucleus; green, F-actin) showing fiber array guiding cellular orientation, as confirmed by the orientation histograms. (D) Schematic of the impedimetric sensor. (E) Time-lapsed in situ impedance measurement as a function of frequency. (F) Plot of impedance at 10 kHz versus time (after cell sedimentation), to compare with the time-lapsed imaging of cell-fiber interaction in (G). Scale bars, 150 μm.
