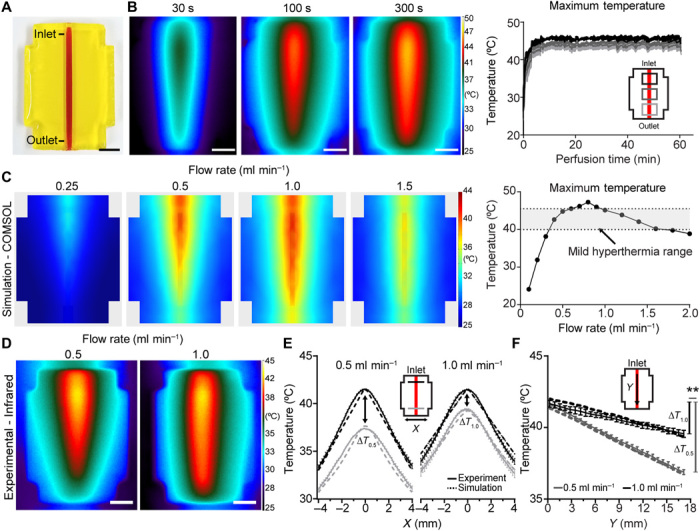
Fig. 2. Thermal profile characterization in perfused hydrogels.

(A) Photograph of a single-channel bioprinted hydrogel used for initial thermal characterization. Scale bar, 5 mm. (B) Representative infrared images from controlled perfusion of heated fluid through the channel over time (left). Scale bars, 5 mm. (C) Representative finite-element modeling images depicting steady-state predictions on the surface of perfused hydrogels at varying flow rates and constant heater power (left; full dataset in fig. S1B). Computational modeling predicts that flow rate can achieve maximal hydrogel temperatures in the mild hyperthermia temperature range (right, gray shading denotes mild hyperthermia range). (D) Hydrogels were experimentally perfused at flow rates of 0.5 and 1.0 ml min−1 and imaged using infrared thermography. Scale bars, 5 mm. (E) Hydrogel temperature plotted orthogonal (x) to the flow direction at inlet and outlet positions show agreement between thermal gradients in computational and experimental measurements (computational, dashed lines; experimental, solid lines). (F) Hydrogel temperature plotted parallel (y) to flow direction demonstrates a larger temperature drop from inlet to outlet (y) during flow at 0.5 ml min−1 (∆T0.5) compared to flow at 1.0 ml min−1 (∆T1.0) in computational and experimental models (computational, dashed lines; experimental, solid lines; n = 5, data are mean temperature ± standard error, **P < 0.01 by Student’s t test). Photo credit: Daniel Corbett, University of Washington.
