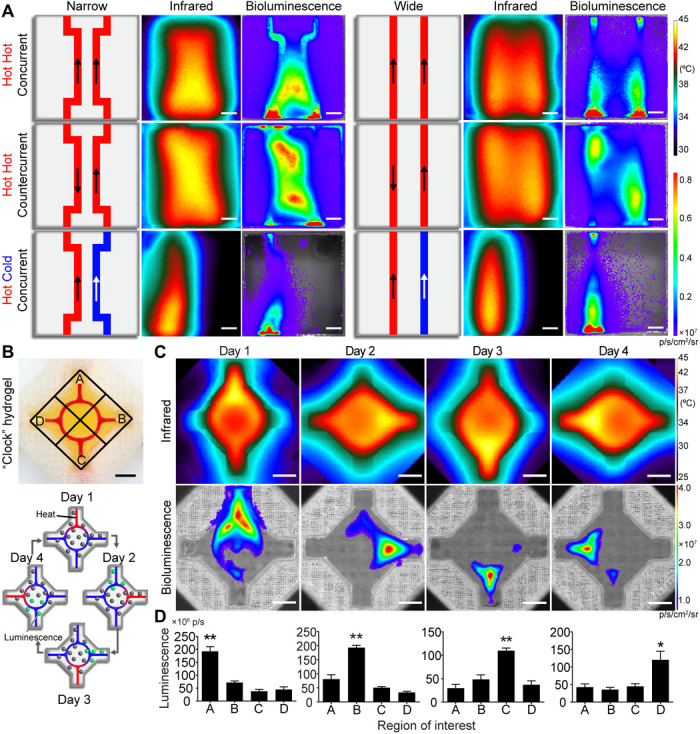
Fig. 4. Heated perfusion of complex network architectures localizes gene expression in space and time.

(A) Heat exchanger inspired designs for various flow directions, fluid temperatures, and channel architectures (schematics; left and center). Representative thermal (middle) and bioluminescent (right) images demonstrate spatial tunability of thermal and gene expression patterning. Scale bars, 5 mm. (B) Photographic image of four-armed clock-inspired hydrogel used for dynamic activation (top; channel filled with red dye). Each inlet is assigned to a local region (A to D). Schematic shows the spatial and dynamic heating pattern for the 4-day study (bottom). (C) Representative infrared (top) and bioluminescence expression (bottom) images for dynamic hydrogel activation at each day during the time course. (D) Quantification of local bioluminescent signals from regions of interest corresponding to each day of heating. Across all 4 days, regions corresponding to perfused arms had higher bioluminescent signals than nonperfused arms (n = 5, data are mean luminescence ± standard error; *P < 0.05 and **P < 0.01 by one-way ANOVA followed by Tukey’s post hoc test).
