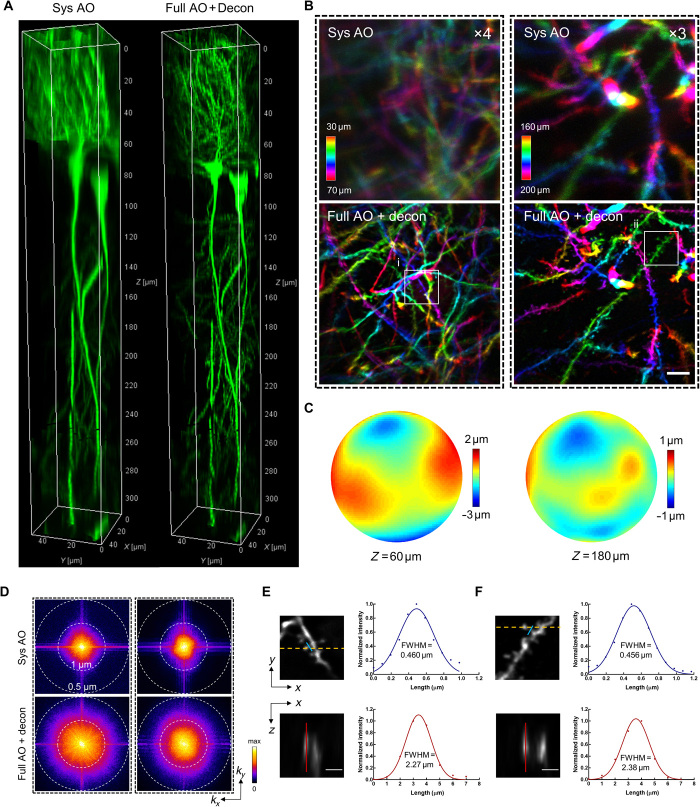
Fig. 2. Direct wavefront sensing AO effectively restores diffraction-limited resolution at depth during in vivo brain imaging.
(A) 3D reconstruction of a column (center located at r = 60 μm) of hippocampal CA1 pyramidal neurons in Thy1-GFP mice imaged with our two-photon endomicroscope with system correction only (left) and with full correction plus subsequent deconvolution (right). Full AO correction is performed every 30 μm of depth. (B) Depth color-coded xy maximum intensity projection (MIP) of the stack images (left column: 30 to 70 μm; right column: 160 to 200 μm) from 3D images in Fig. 1A. The images with system correction have been digitally enhanced four- and threefold as indicated for better visualization. Scale bar, 5 μm. (C) Corrective wavefronts of the DM used for full AO correction of the stack images in (B). (D) Spectral power in spatial frequency space (kx, ky) for the images in (B). (E and F) Magnified views of the dendritic spines corresponding to the boxed regions (i and ii) in (B). The spines are shown in lateral (xy) and axial (xz) views. The axial view is shown through the plane defined by the yellow dashed line. Intensity profiles along the blue and red lines are plotted with the curve fitted by a Gaussian function. Scale bars, 2 μm. FWHM, full width at half maximum.

