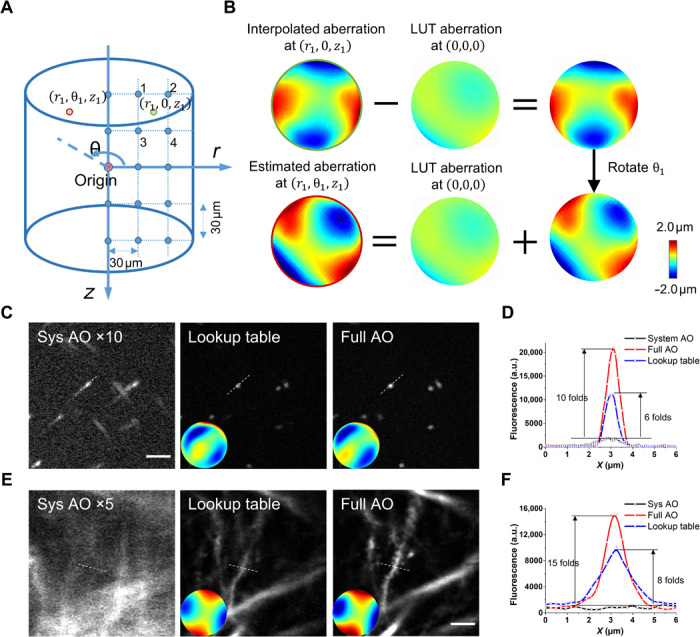
Fig. 3. Lookup table–based precompensation for GRIN lens aberrations.

(A) Calibration of the lookup table. The cylindrical coordinate system was used to describe the imaging location. The origin is defined as the center located at the designed working distance of the GRIN lens. The entire imaging FOV had a radius of 150 μm and a depth of 300 μm. We measured the intrinsic aberration of the GRIN lens in the θ = 0 subplane at 30-μm intervals, shown as blue dots. (B) Estimation of GRIN lens–induced aberration using the lookup table. To find the aberration at location (r1, θ1, z1) [red circle in (A)], we first estimate the aberration at the rotational symmetrical point (r1, 0, z1) using linear interpolation of the aberrations nearby (the blue dots labeled 1 to 4). Then, the aberration at the origin is subtracted from the interpolated wavefront distortion, and the resulting wavefront is rotated by the angle θ1 and added back to the aberration at the origin. LUT, lookup table. (C and D) In vitro imaging using fluorescent beads of 200 nm in diameter. (C) Fluorescence images with system AO, lookup table, and full AO correction. The insets show the corresponding corrective wavefront. (D) Intensity profile along the dashed lines in (C). (E and F) In vivo imaging of hippocampal neurons in mice. (E) Fluorescence images with system AO, lookup table, and full AO correction. Scale bar, 5 μm. (F) Intensity profile along the dashed lines in (E).
