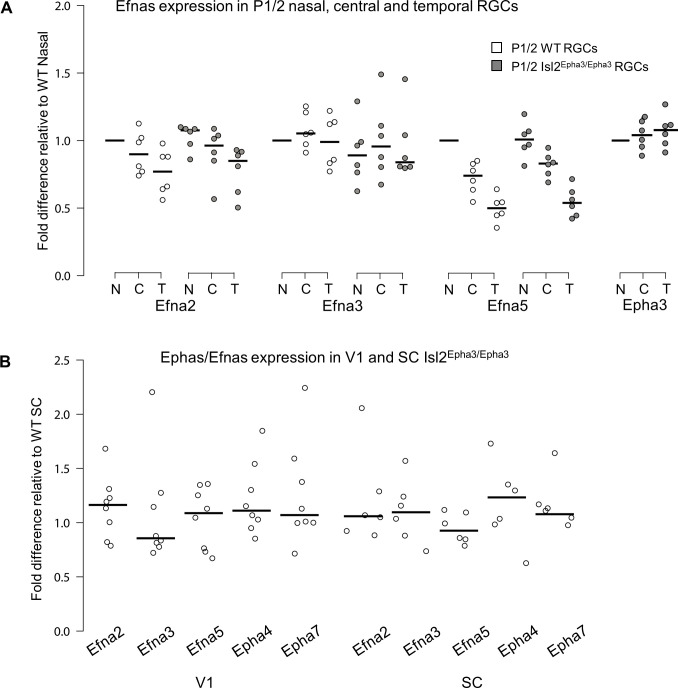
Figure 1. Dot plots representing Ephas/Efnas expression in Isl2Epha3/Epha3retinas, V1 cortex and SC.
(A) Median Efna2/a3/a5 expression levels (relative to wild-type nasal expression) in P1/2 wild-type (WT - white) and Isl2Epha3/Epha3 (gray) acutely isolated RGCs from nasal (N), central (C) and temporal (T) retinas (WT, Isl2Epha3/Epha3, n = 6 animals, 12 retinas), Two-way ANOVA without replication: Efna2 x genotype: F(1,2) = 3.72 < Fcrit.=18.5, p=0.19; Efna3 x genotype : F(1, 2)=11.13 < Fcrit.=18.5, p=0.07; Efna5 x genotype: F(1, 2)=3.58 < Fcrit.=18.5, p=0.20. (B) Median Efna2/a3/a5 ligands and Epha4/a7 receptors expression levels (relative to WT expression levels) in Isl2Epha3/Epha3 V1 (WT n = 5 animals, Isl2Epha3/Epha3n = 8 animals; variables are normally distributed, one sample t-test: Efna2: p=0.29; Efna3: p=0.43; Efna5: p=0.42; Epha4: p=0.07; Epha7: p=0.54) and SC (WT n = 5 animals, Isl2Epha3/Epha3n = 6 animals; variables are normally distributed, one sample t-test: Efna2: p=0.20; Efna3: p=0.65; Efna5: p=0.71; Epha4: p=0.11; Epha7: p=0.17). qPCRs were repeated three times with duplicates for each sample.

