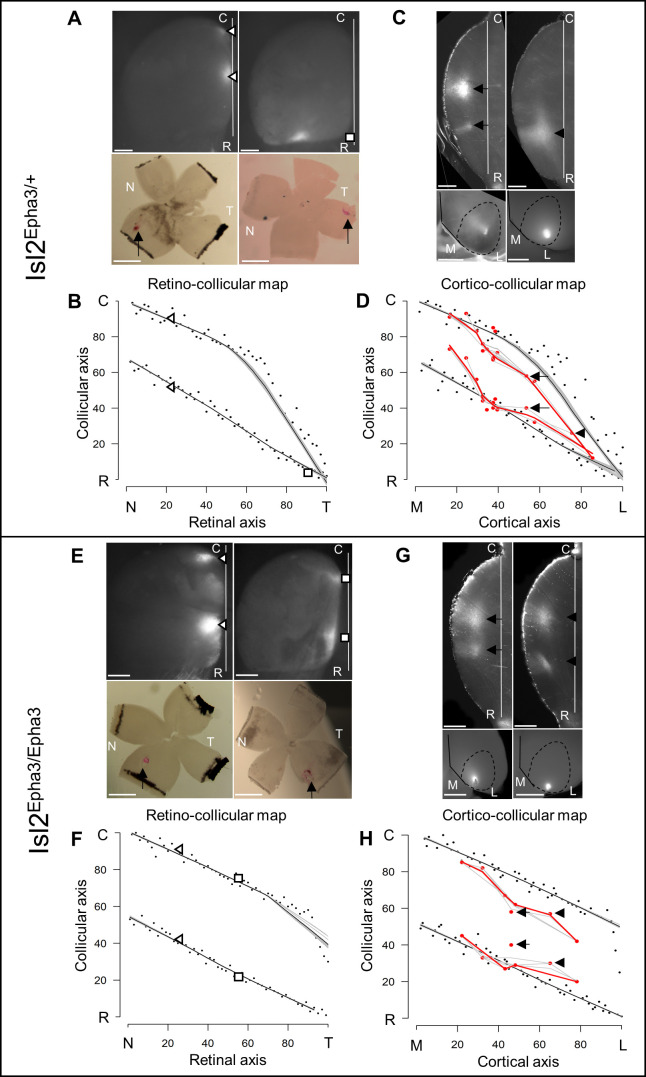
Figure 3. Experimental validation of retino- and cortico-collicular mapping in Isl2-Epha3KI animals.
(A) Images of two experimental injections showing the collicular terminations zones (triangles and square, top-view, upper panels) after focal retinal injections (arrows, flat-mount, lower panel) in Isl2Epha3/+ animals. (B) Cartesian representation of the injections (triangles and square) in (A) superimposed with the simulated RC map (black dots, n = 100) in Isl2Epha3/+. Map profile is calculated by LOESS smoothing (black and gray lines). (C) Images of two experimental injections showing the collicular termination zones (sagittal view, upper panels) after focal cortical V1 injection (top-view, lower panels). Arrows and arrowheads indicate the site of the termination zones. Lower left panel shows CO staining (dark gray) delineating V1. (D) Cartesian representation of the experimental (red dots/lines, n = 15 animals) and simulated (black dots, n = 100) CC maps calculated by LOESS smoothing (black, red and gray lines). Arrows and arrowhead represent the two injections shown in (C). Two-samples Kolmogorov-Smirnov test, D-stat = 0.273 < D-crit.=0.282, p=0.06, simulated and experimentally measured CC maps are not significantly different. (E) Images of two experimental injections showing the collicular terminations zones (triangles and squares, top-view, upper panels) after focal retinal injection (arrows, flat-mount, lower panel) in Isl2Epha3/Epha3 animals. (F) Cartesian representation of the injections (triangles and squares) in (E) superimposed with the simulated RC map (black dots, n = 100) in Isl2Epha3/Epha3. Map profile is calculated by LOESS smoothing (black and gray lines). (G) Images of two experimental injections showing the collicular duplicated termination zones (arrows and arrowheads, sagittal view, upper panels) after focal cortical V1 injection (top-view, lower panels). (H) Cartesian representation of the experimental (red dots/lines, n = 7 animals) and simulated (black dots, n = 100) CC maps calculated by LOESS smoothing (black, red and gray lines). Arrows and arrowheads represent the two examples in (G). Two-samples Kolmogorov-Smirnov test, D-stat = 0.190 < D-crit.=0.371, p=0.72, simulated and experimentally measured CC maps are not significantly different. Scale bars: 400 μm (A upper, C, E upper, G), 1 mm (A, E lower). Abbreviations: N, nasal; T, temporal; R, rostral; C, caudal; M, medial; L, lateral.

