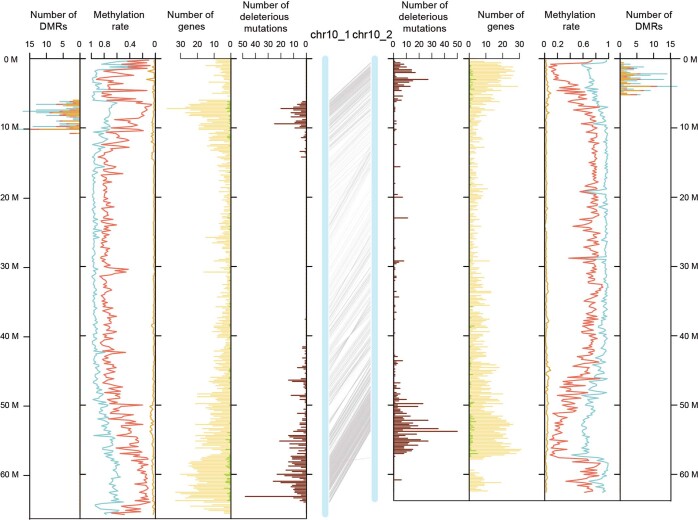
Extended Data Fig. 8. Haplotype alignment of RH chromosome 10.
The central blue bars represent the two haplotypes of chromosome 10 with the gray lines indicating the paired allelic genes. The distribution of deleterious or dysfunctional mutations (brown), annotated genes (yellow), preferentially expressed alleles (green), methylation level of three contexts and differentially methylated regions are arranged symmetrically for each haplotype. The methylation level and the number of DMRs of methylated sites in CG (light blue), CHG (red) and CHH (orange) contexts are indicated by cumulative column chart. Number of DMRs on one haplotype only involves the DMRs with hyper-methylation. All of the numbers were determined in 200 kb windows.

