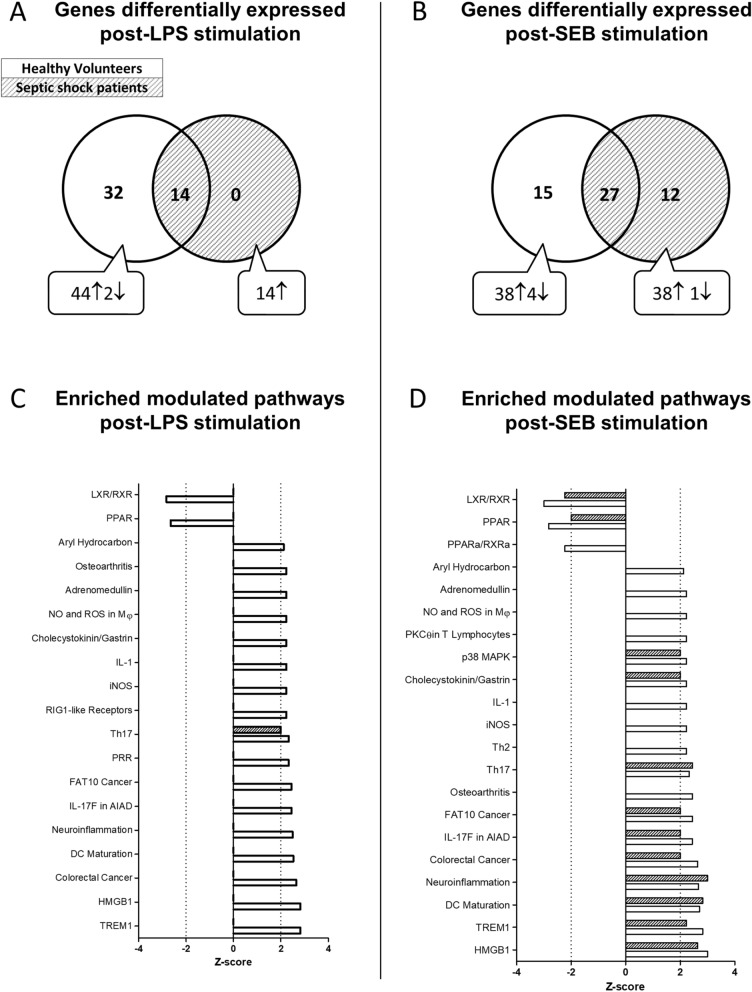
Figure 1.
Contrasted response to LPS and SEB stimulation in healthy volunteers (HV) and septic shock patients. Venn diagrams for differentially expressed genes (adjusted p value < 0.05 in > 75% of tests) between 10 HV (white circle) and 30 septic shock patients (dashed circle) (A) upon LPS or (B) SEB stimulation for 24 h. Enriched-modulated pathways (Z-score positive activation, Z-score negative inhibition) derived from differentially expressed genes (using ingenuity analysis) for HV (solid bars) and septic shock patients (hashed bars) (C) upon LPS and (D) SEB stimulation. LPS lipopolysaccharide, SEB staphylococcal enterotoxin B.

