Figure 3.
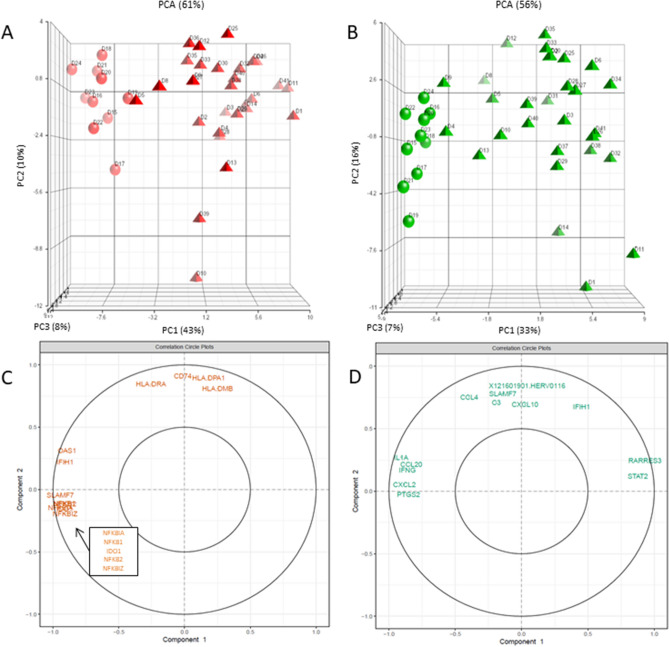
Genes contributing to the higher variance in responses following LPS and SEB stimulation for healthy volunteers (HV) and septic shock patients. PCA of 10 HV (circles) and 30 septic shock patients (triangles) response (stimulation/NUL) to (A) LPS stimulation (red) and (B) SEB stimulation (green). Every donor is labelled. The percentage of variance captured by each PC axis is indicated, as well as the total variance. Vector position for each donor were plotted and visualisation was executed with Partek. The most important variables are plotted (representing 15% of the total variables weight for PC1 and PC2) for (C) LPS response and (D) SEB response. LPS lipopolysaccharide, SEB staphylococcal enterotoxin B, PCA principal component analysis, PC principal component.

