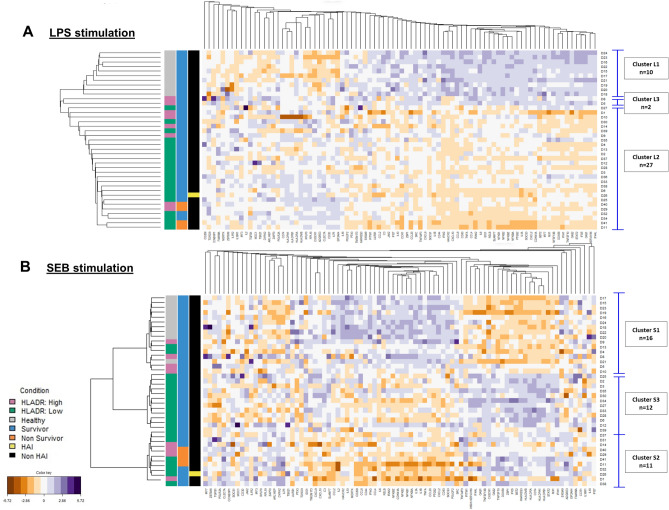
Figure 4.
Multivariate clustering analysis upon LPS and SEB stimulation. 10 healthy volunteers and 30 septic shock patients were treated as a whole to discriminate associative gene patterns. (A) LPS response revealed 3 clusters of individuals (L1; n = 10, L2; n = 27 and L3; n = 2) using hierarchical method and manhattan distances. (B) SEB response revealed 3 clusters in the discovery cohort (S1; n = 16, S2; n = 11 and S3; n = 12) using PAM method with correlation distance. The homemade dendogram is based on the distance between the individuals from the medoid of each cluster found by PAM. Darker purple colours on the heat map indicates higher fold change for upregulated genes (stimulation/control condition), while darker orange colours indicate higher fold change for downregulated genes. 10,000 AB/c was used as a threshold for high and low mHLA-DR. LPS lipopolysaccharide, SEB staphylococcal enterotoxin B, HLA-DR human leukocyte antigen DR, HAI hospital-acquired infection.

