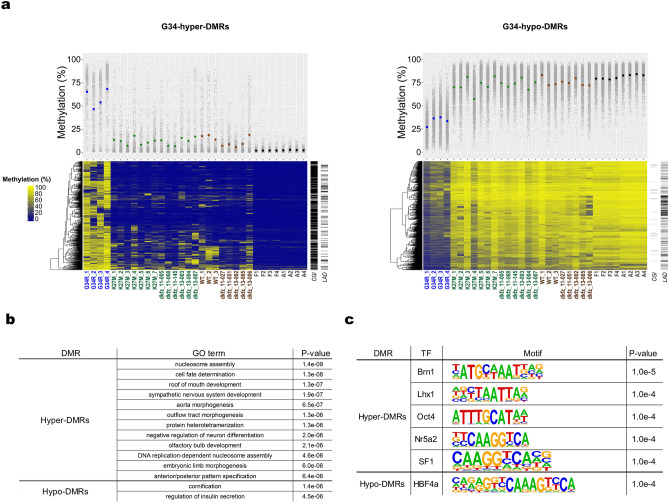
Figure 3.
Hypermethylated and hypomethylated regions specific to the G34 subgroup. (a) G34-hyper-DMRs and G34-hypo-DMRs. Raw methylation levels are used for hierarchical clustering of DMRs. Rows and columns of the heatmap indicate DMRs and samples, respectively. Ladders on the right side of each panel indicate CGIs and LADs. G34R, N = 4; K27M, N = 13; WT, N = 8; Normal, N = 8. (b) GO enrichment analysis of DMRs. See Table S3 for details. (c) Transcription factor-binding motifs enriched in DMRs.

