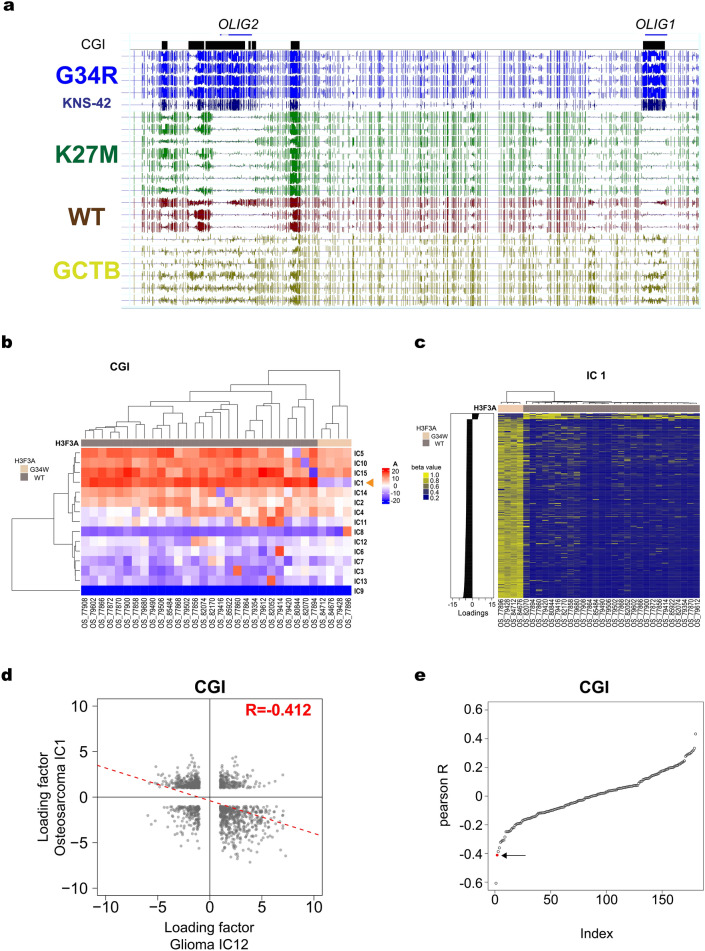
Figure 5.
Methylomic signature shared by gliomas and bone tumors bearing G34 mutations. (a) Genome browser shot of OLIG1/OLIG2 locus in gliomas and GCTBs. (b) Unsupervised hierarchical clustering of osteosarcoma samples and ICs by mixing matrix coefficients. Results are shown for ICA of CGIs based on the methylation array data (N = 32)15. Arrowhead indicates IC1, which shows distinct weighting patterns between tumors with and without G34W mutation. (c) Unsupervised hierarchical clustering of osteosarcoma samples by raw methylation levels of CGIs. Genes with LFs larger than 3 or smaller than − 3 are used for clustering. (d) Correlation plot of LFs between glioma IC12 and osteosarcoma IC1, both specific to G34 subgroup. ICA was performed using CGIs. (e) Pearson’s correlation coefficients of all possible pairs between ICs identified in ICA of glioma and osteosarcoma. ICA uses CGIs and the coefficients are sorted by their values. Red circle pointed by the arrow indicates the pair of G34-specific ICs (i.e., glioma IC12 and osteosarcoma IC1).

