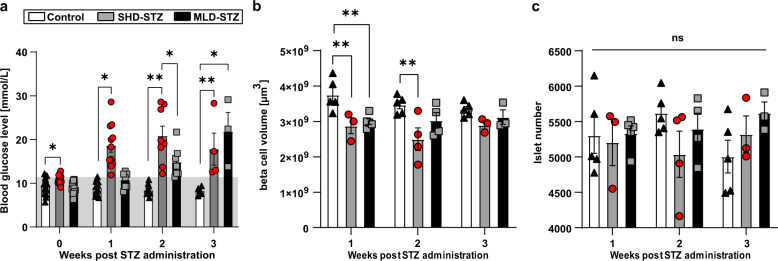
Fig. 2. Mice with STZ-induced hyperglycemia display a modest reduction in BCM and unchanged islet numbers.
a Blood glucose levels following SHD-STZ and MLD-STZ administration. n = 15 (week 0), n = 15 (week 1), n = 10 (week 2), and n = 5 (week 3). b Average BCM (defined here as β-cell volume, see text) in entire pancreata from hyperglycemic STZ-treated mice compared to untreated controls. Given the tomographic method of detection, BCM here corresponds to the volume of islet β-cells. c Average islet number in entire pancreata from hyperglycemic STZ-treated mice compared to untreated controls. In (b, c) n = 5 in controls at 1–3 weeks, n = 3 at 1 and 3 weeks and n = 4 at 2 weeks in SHD-STZ, n = 5 at 1 week, n = 4 at 2 weeks and n = 3 at 3 weeks in MLD-STZ. Gray shade in (a) represent normoglycemic levels, as defined by blood glucose concentration ≤12 mmol/L. Error bars represent SEM. * represents P ≤ 0.05, ** represents P ≤ 0.01.

