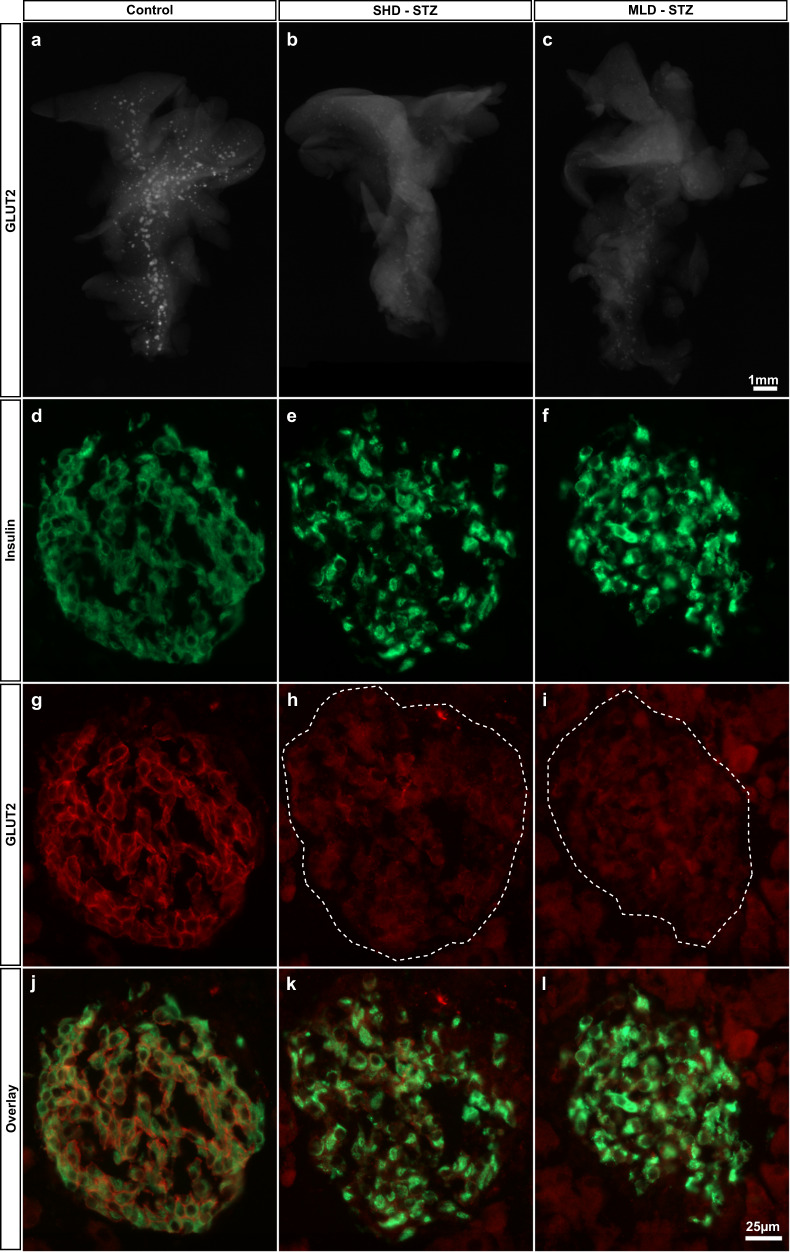
Fig. 5. STZ administration results in a pancreas-wide downregulation of GLUT2 expression.
a–c Representative OPT projection images showing GLUT2 expression in the intact splenic lobe of the pancreas of control (a), SHD-STZ (b) and MLD-STZ (c) hyperglycemic animals 3 weeks post-STZ administration. OPT images are representative of n = 5, 4, and 3 pancreata for control, hyperglycemic SHD-STZ, and hyperglycemic MLD-STZ conditions, respectively. d–l Immunohistochemical staining for insulin (d–f, green), GLUT2 (g–i, red), and insulin+GLUT2 (j–l) of pancreata from control (d, g, j), hyperglycemic SHD-STZ (e, h, k) and MLD-STZ (f, i, l) animals 3 weeks post-administration of STZ confirms the downregulation of GLUT2 in STZ-treated animals. In (h, i), the islet is indicated by a broken line.

