Fig. 5.
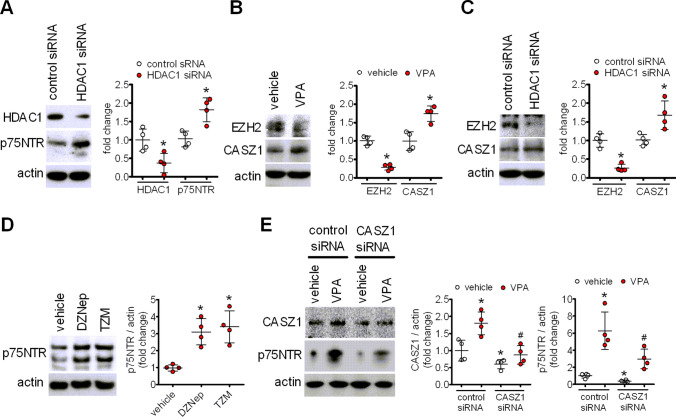
VPA-induced p75NTR upregulation is mimicked by HDAC1 knockdown and involves CASZ1 derepression. a SH-SY5Y cells were transfected with either control siRNA or HDAC1 siRNA duplexes and cell lysates were analysed for HDAC1 and p75NTR expression 48 h post-transfection. Values are the mean ± SD of four separate experiments. *p < 0.05 vs. the corresponding sample treated with control siRNA. b, c Cells treated for 24 h with either vehicle or 1 mM VPA (b) or transfected with either control or HDAC1 siRNAs (c) were analysed for the levels of EZH2 and CASZ1 by Western blot. Values are the mean ± SD of four separate experiments. *p < 0.05 vs. control (vehicle) or the corresponding sample treated with control siRNA. d Cells were treated for 72 h with either vehicle, deazaneplanocin (a) (DZNep) (1 µM) or tazemetostat (TZM) (1 µM). The levels of p75NTR were measured by Western blot and normalised to actin. Values are the mean ± SD of four independent experiments. *p < 0.05 vs. vehicle. e Cells were transfected with either control siRNA or CASZ1 siRNA and 45 h post-transfection treated with either vehicle or 1 mM VPA for 24 h. Cell lysates were analysed for the expression of CASZ1 and p75NTR by Western blot. Values are the mean ± SD of four experiments. *p < 0.05 vs. vehicle in control siRNA-treated cells; #p < 0.05 vs. VPA in control siRNA-treated cells

