FIGURE 2.
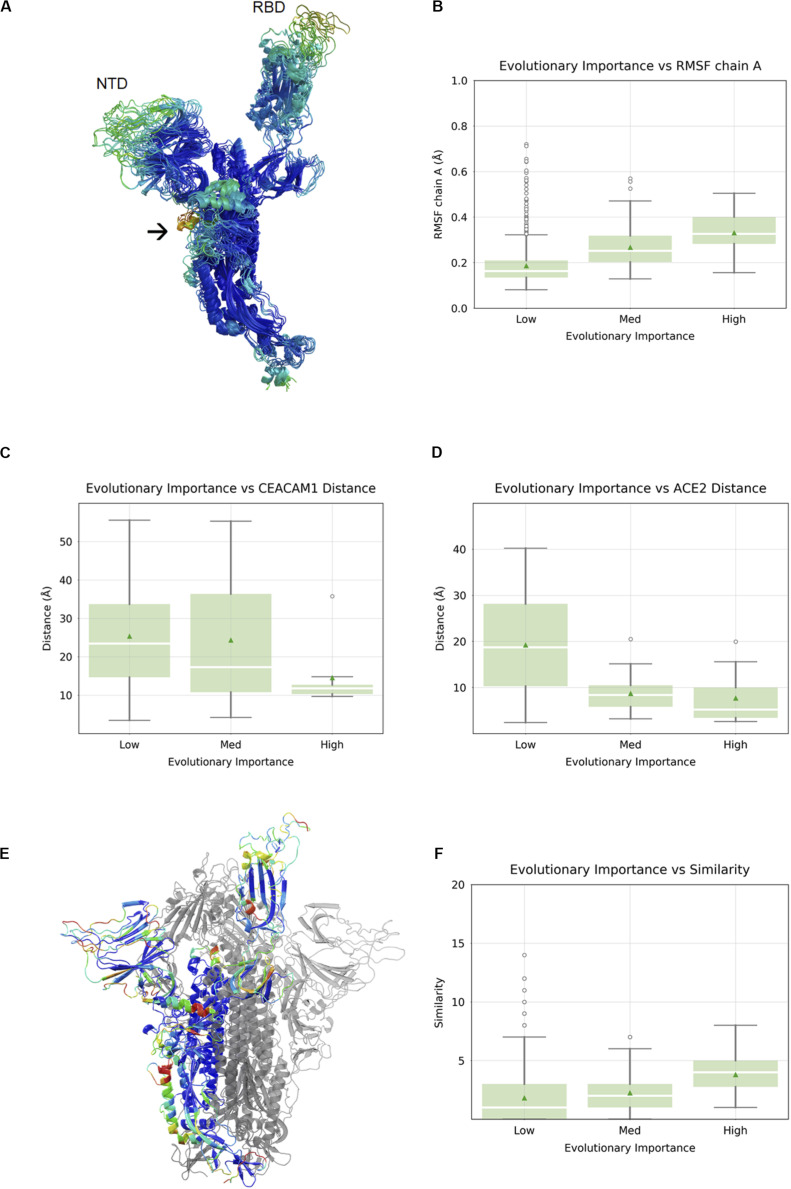
Correlation between evolutionary importance and other properties. (A) The ectodomain of the spike protein colored according to the root-mean square fluctuation (RMSF), with the scale going from blue (low RMSF), via green and yellow to red (high RMSF). The NTD and RBD are labeled, and an arrow indicates the location of the fusion peptide. (B) Boxplot of RMSF as a function of evolutionary importance indicating that evolutionary importance is higher in flexible regions. (C) Boxplot of distance from carcinoembryonic antigen-related cell adhesion molecule 1 (CEACAM1) interface, as inferred from superposition on MHV, for residues in the three groups of evolutionary importance. (D) Boxplot of distance from ACE2-binding site for residues in the three groups of evolutionary importance. (E) Similarity is represented as a heatmap (from low to high: blue, cyan, green, yellow, orange, red) on a single chain of the spike protein with the other two chains shown in gray. (F) Boxplots showing similarity to human proteins highest for evolutionary important residues.

