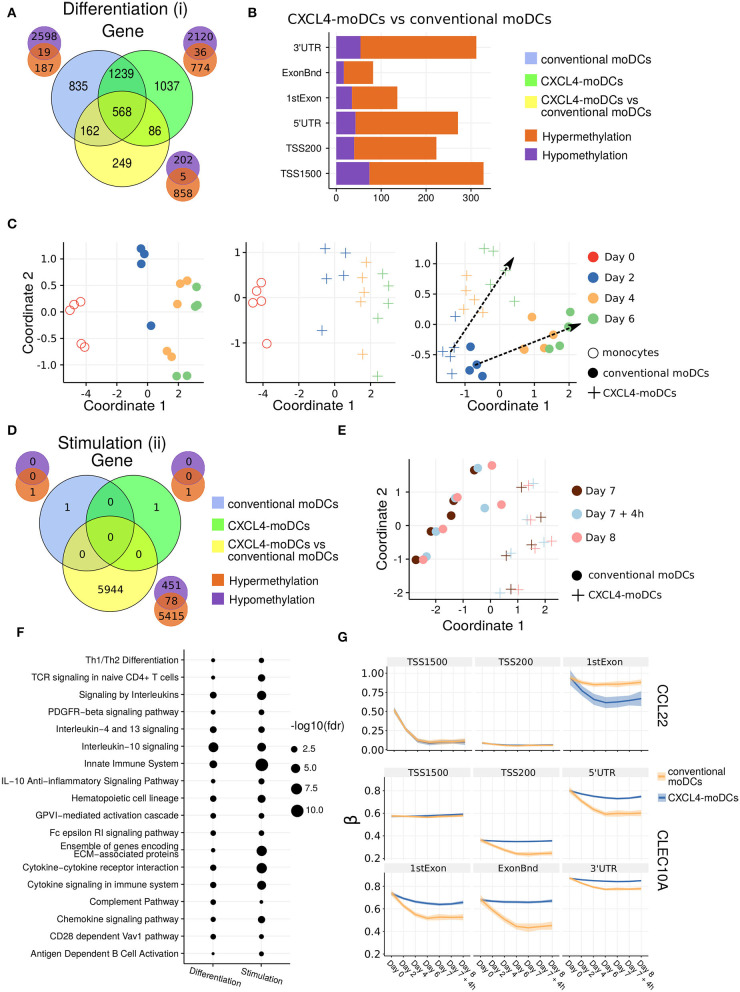
Figure 2.
DNA methylation analysis of CXCL4-moDCs and conventional moDCs. (A) Overlap between differentially methylated genes (DMGs) found during differentiation similar to Figure 1B. A gene is considered differentially methylated if any region on the gene is differentially methylated. Smaller Venn diagram graphs display the overlap of hyper-methylated (orange) and hypo-methylated (purple) genes for each comparison. Note some genes are classified as both hyper-methylated and hypo-methylated based on different regions. (B) Distribution of differentially methylated regions (1,500 and 200 base pairs upstream of the transcription start site (TSS), 5' untranslated region (UTR), 1st exon, other exons (ExonBnd) and 3' UTR) between CXCL4-moDCs and conventional moDCs during differentiation. (C) MDS analysis using DMRs, similar to Figure 1D. (D) Overlap between DMGs found during stimulation similar to Figure 1C. (E) MDS analysis using all DMRs between CXCL4-moDCs and conventional moDCs during stimulation. (F) Top enriched pathways from DMGs between CXCL4-moDCs and conventional moDCs during differentiation and stimulation. (G) DNA methylation β values (see Methods) of CCL22 and CLEC10A. Lines represent mean β values and shading represents 95% confidence interval.

