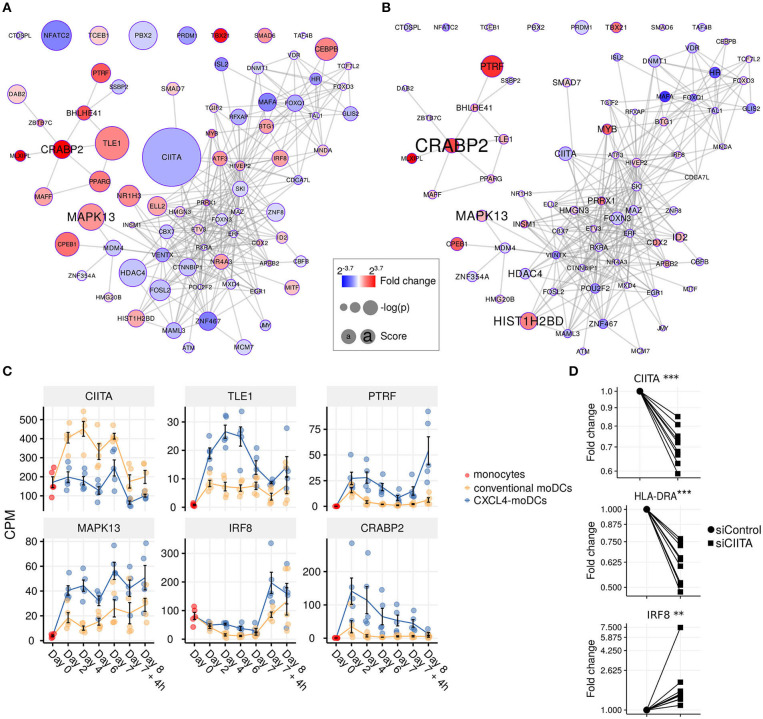
Figure 4.
Transcription regulator enrichment highlights key TF candidates. Co-expression based key TF network during: (A) differentiation and (B) stimulation. Colors indicate fold change between CXCL4-moDCs and conventional moDCs. Red represents upregulation and blue represents downregulation. Circle size indicates –log10(p) for each comparison, where p is the p-value calculated during differential expression analysis; text size shows the RegEnrich score (see Methods). (C) Expression profile (mean±SEM) of key regulators. (D) Expression of CIITA, HLADRA, and IRF8 on day 6 measured by qPCR in moDCs obtained from monocytes transfected with silencer negative control siRNA (siControl) or silencer CIITA siRNA (siCIITA). qPCR data were normalized using mean expression of RPL32 and RPL13A. Fold change in y-axis (log2 scaled) is relative to the value obtained for siControl for each donor. Lines connect individual donors. *P < 0.05, ***P < 0.001, paired two-sided Student's t-test or two-sided Wilcoxon signed rank sum test (see Statistical Analyses in Materials and Methods).

