Figure 5.
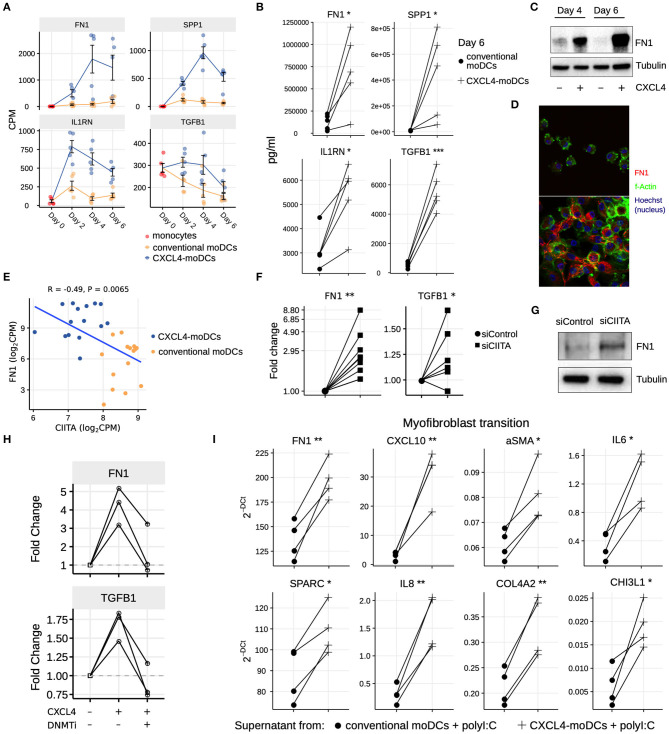
CXCL4 induces production of ECM components in moDCs and fibroblasts. (A) Expression of genes implicated in ECM remodeling (mean±SEM). (B) Validation (luminex) of ECM protein production in CXCL4-moDCs and conventional moDCs on day 6. (C) Fibronectin (FN1) expression (tubulin as loading control) determined using Western blot on days 4 and 6 (representative of 5 independent experiments). (D) Fibronectin (red) synthesis determined using confocal imaging on day 6 (green: f-actin; and blue: nucleus staining using Hoechst). (E) Pearson correlation between gene expression of CIITA and FN1 during differentiation (i.e., on day 2, 4, and 6). (F) FN1 and TGFB1 expression measured by qPCR and (G) FN1 expression measured by western blot on day 6 moDCs obtained from monocytes transfected with siControl and siCIITA (see Figure S8D). (H) FN1 and TGFB1 expression measured by qPCR on day 3 in conventional moDCs, CXCL4-moDCs and CXCL4-moDCs exposed to DNMT inhibitor (100 nM 5-Aza-2′-deoxycytidine). (I) Expression of ECM genes measured using qPCR in healthy dermal fibroblasts (one representative donor; for others see Figure S9) co-cultured with supernatants from CXCL4-moDCs and moDCs that were stimulated for 24 h with polyI:C. qPCR data were normalized using mean expression of RPL32 and RPL13A. In panels (B,F,H,I) lines connect individual donors. *P < 0.05; **P < 0.01, ***P < 0.001, paired two-sided Student's t-test or two-sided Wilcoxon signed rank sum test (see Statistical Analyses in Materials and Methods).

