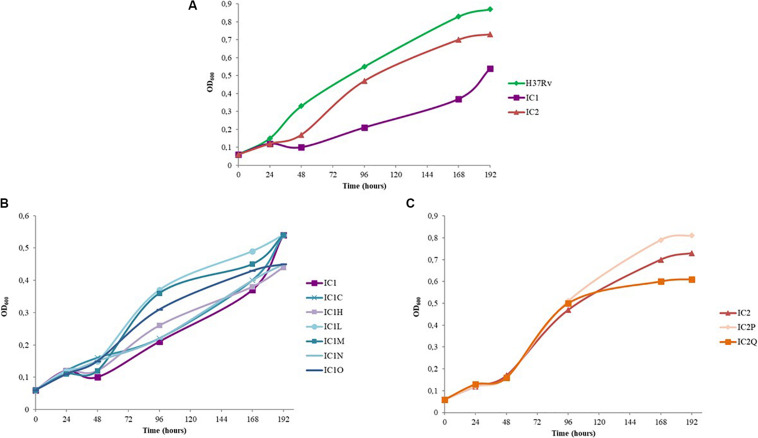
FIGURE 1.
Growth curves of standing cultures of M. tuberculosis strains (H37Rv, clinical isolates and mutant strains). The experiment was repeated three times giving comparable results. The figure shows one representative experiment. (A) Growth curves of M. tuberculosis H37Rv strain and IC1 and IC2 clinical isolates. (B) Growth curves of IC1 clinical isolate and the following BDQ resistant mutants: IC1 C (representative mutant strain with A63P mutation in AtpE), IC1 H, IC1 L, IC1 M, IC1 N, IC1 O. (C) Growth curves of IC2 clinical isolate and the BDQ resistant mutants IC2 P and IC2 Q.

