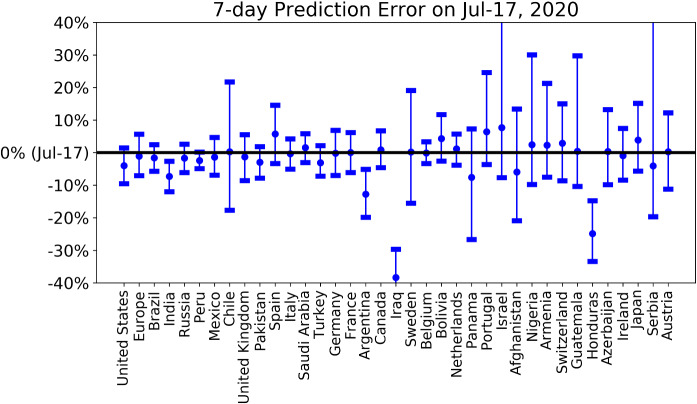
Fig. 10.
7-day prediction error of the forecast performed on July 10 for the total number of deaths for the various countries/regions. The horizontal line corresponds to empirical data on July 17. The errorbars are 80% prediction intervals and the middle dots are the median predictions based on the predictions from the positive and medium scenarios. A negative value corresponds to a prediction that underestimated the true realised value

