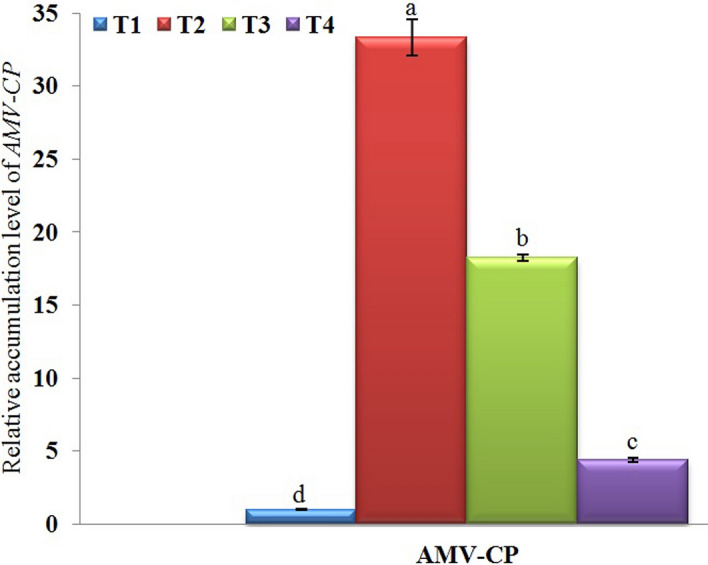
Figure 2.

A histogram showing the relative expression level of AMV-CP gene in AMV-infected potato plants at 21 days post inoculation. Where, T1 = Mock-treated plants (Control), T2 = plants inoculated with AMV only, T3 = plants treated with CF 24 h before inoculation of AMV, and T4 = plant treated with CF, 24 h before inoculation of AMV and 24 h after inoculation with AMV. Columns represent mean value from three biological replicates and bars indicate Standard Deviation (± SD). Significant differences between samples were determined by one-way ANOVA using CoStat software. Means were separated by Least Significant Difference (LSD) test at P ≤ 0.05 levels and indicated by small letters. Columns with the same letter means do not differ significantly.
