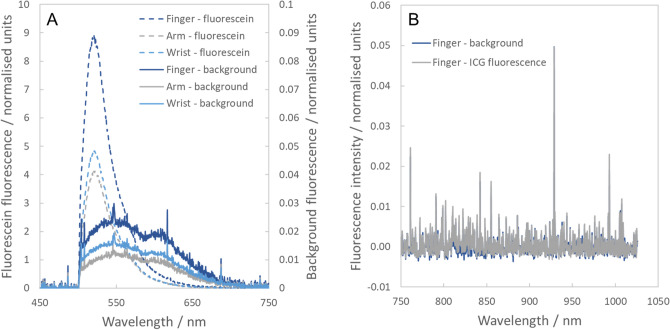
Figure 2.
Transcutaneous spectroscopy of IV fluorescent contrast agents. (A) Fluorescence spectra observed in an ophthalmology patient who received an IV injection of fluorescein. Dotted lines represent measurements made after injection of fluorescein (left axis, 100 ms acquisition times) and solid lines represent background measurements recorded before injection of fluorescein (right axis, 5 s acquisition times). (B) Fluorescence spectra recorded in an ophthalmology patient who received an injection of ICG (blue—before injection; grey—after injection).

