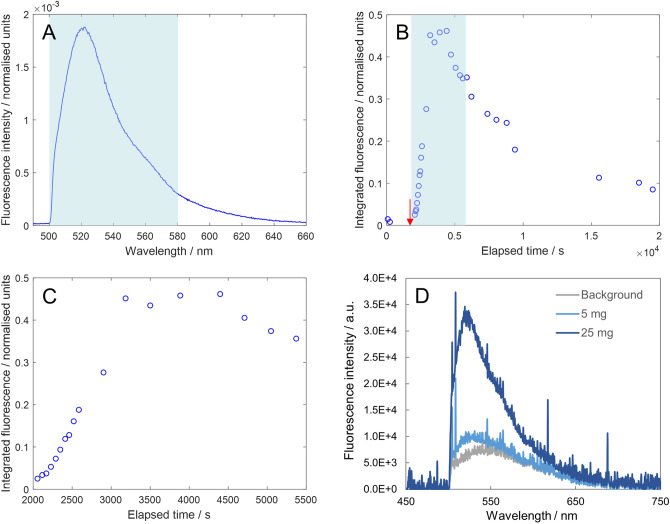
Figure 3.
Transcutaneous spectroscopy of orally ingested fluorescein. (A) Example fluorescence spectrum recorded 16 min after ingestion of fluorescein (acquisition time = 250 ms). Blue shaded region indicates the wavelength range (500–580 nm) that was summed to calculate the normalised integrated fluorescence intensity (see details in “Methods”). (B) Normalised integrated fluorescence intensity as a function of time. The red arrow indicates the time at which the fluorescent dye was ingested by the participant (1920 s). (C) Close-up of the blue shaded region in (B) revealing an S-shaped uptake curve in the first hour after ingestion. (D) Spectra recorded in limit of detection experiment. Fluorescence from 5 mg of fluorescein was just detectable above the background (spectrum recorded 29 min after ingestion) while the signal from 25 mg of fluorescein was clearly observable (spectrum recorded 37 min after ingestion).

