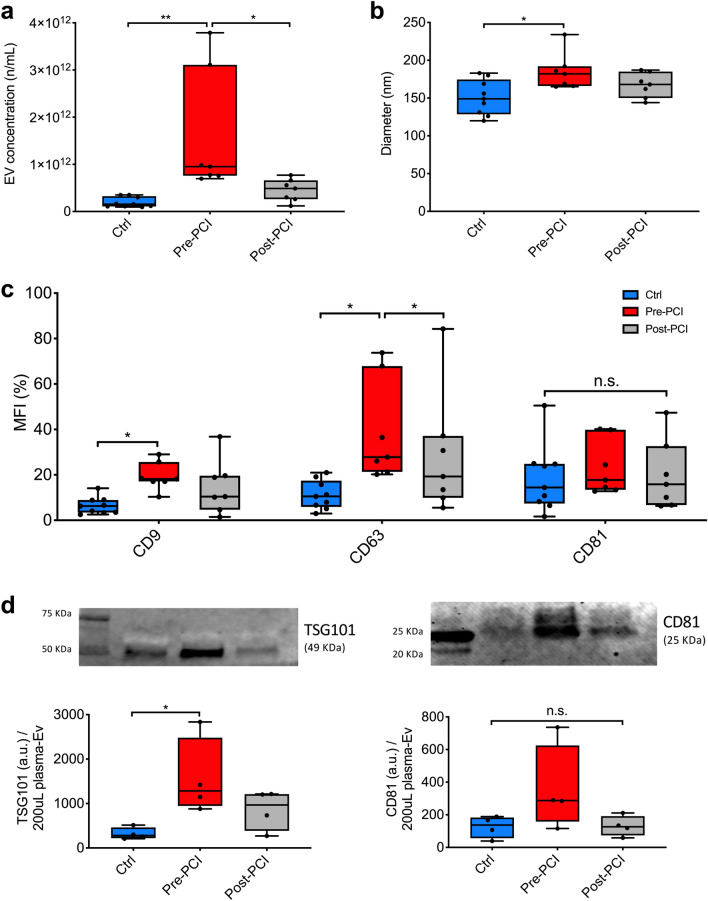
Figure 2.
EV characterization. (a, b) EV concentration (particles/mL) and nanometer diameter (nm) were assessed by NTA in patients with a diagnosis of STEMI (n = 7) before PCI and after 24 h from reperfusion, as compared to controls (Ctrl; n = 9). (c) Percentage value of median fluorescence intensity (% MFI) for CD9, CD63, and CD81 assessed by flow cytometry. (d) Western blot analysis for EV specific markers (TSG101 and CD81) in representative patients (n = 4). Level of expression are reported as arbitrary unit (a.u.) in patients with STEMI before and 24 h after reperfusion, as compared to controls. Uncropped representative membranes are shown in Fig. S1c,d. Data and statistical analysis are reported in Table S1. *p < 0.05; **p < 0.01.

