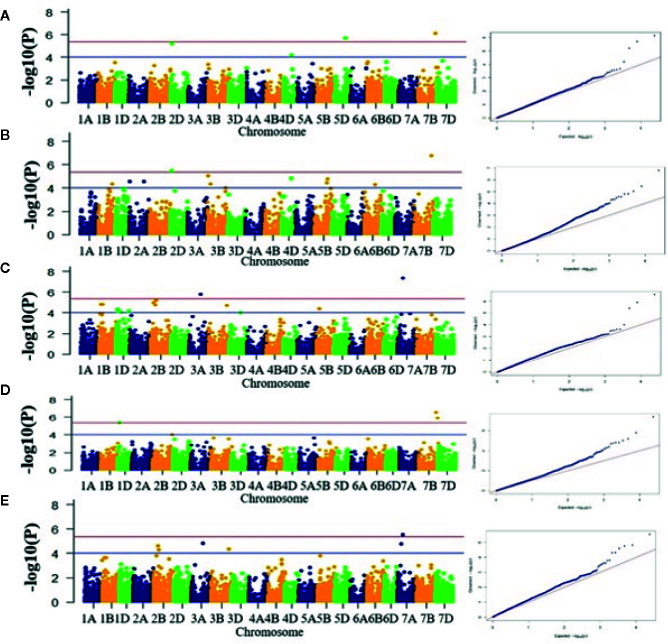
Figure 3.
Manhattan plots for five different traits. (A) DM, (B) PHT, (C) HI, (D) GY, and (E) GFR. X-axis shows position of SNP markers on 21 chromosomes (1A to 7D) and Y-axis shows significance of the association tests on a −log scale. Blue horizontal line represents the draw P value threshold (P value < 01E-4). Red dash line indicates Bonferroni corrected P value (P value < 4.19E-6). Manhattan plots were generated in the qqman R package, v0.1.4 (https://cran.r-project.org/web/packages/qqman/index.html).

