. 2020 Aug 4;19:1102–1119. doi: 10.17179/excli2020-2376

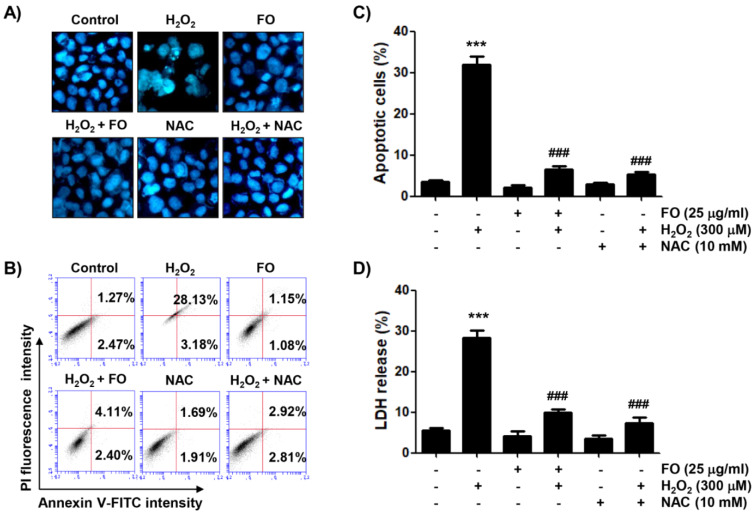
Figure 2. Inhibitory effect of FO on H2O2-induced apoptosis in MC3T3-E1 cells. Cells were pretreated with or without 25 μg FO or 10 mM NAC for 1 h, before treatment with 300 μM H2O2 for 24 h. (A) The cells were stained with DAPI solution, and the stained nuclei were observed by fluorescence microscopy (original magnification, ×200). Each image is representative of at least three independent experiments. (B) and (C) The cells were fixed and stained with annexin V-FITC and PI for flow cytometry analysis. (B) The results show early apoptosis, defined as annexin V+ and PI- cells (lower right quadrant), and late apoptosis, defined as annexin V+ and PI+ (upper right quadrant) cells, and representative profiles are shown. (C) The percentages of apoptotic cells were determined by expressing the numbers of annexin V+ cells as percentages of all the present cells. (D) LDH release into the extracellular medium was measured to determine cytotoxicity. Data represent the mean ± SD of three independent experiments (*** p < 0.001 compared with the control group, ### p < 0.001 compared with the H2O2-treated group).

Figure 2