. 2020 Aug 4;19:1102–1119. doi: 10.17179/excli2020-2376

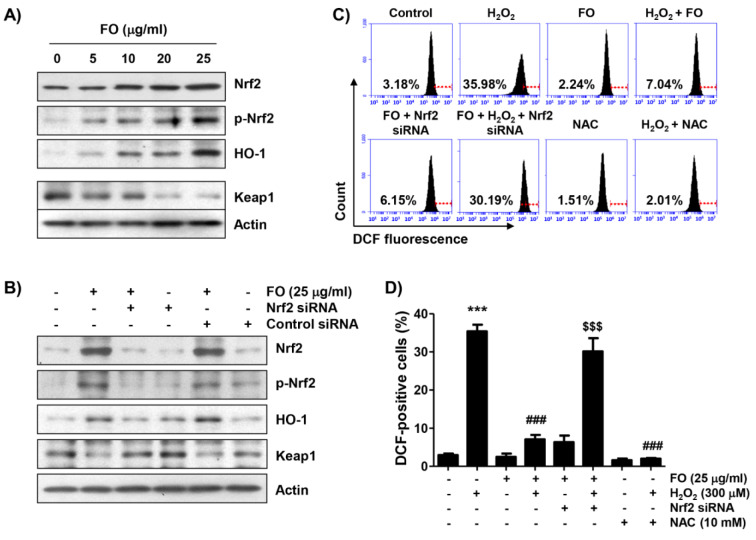
Figure 3. Activation of Nrf2 signaling pathway and inhibition of H2O2-induced ROS generation by FO in MC3T3-E1 cells. (A) Cells were stimulated with the indicated concentrations of FO for 24 h. (B) Cells transfected with either negative control siRNA or Nrf2 siRNA were treated with 25 μg/ml FO for 24 h. (A) and (B) Equal amounts of proteins were separated by SDS-polyacrylamide gel electrophoresis, and subjected to Western blot analysis of the listed proteins. Actin was used as an internal control, and the proteins were visualized using an ECL detection system. (C) and (D) After transfection with or without Nrf2-siRNA, the cells were pretreated with 25 μg/ml FO or 10 mM NAC for 1 h, and then treated with or without 300 μM H2O2 for 1 h. The medium was removed, and the cells were incubated for 20 min with medium containing 10 µM DCFDA for 20 min. (C) ROS production was measured by flow cytometry, and representative profile is shown. The red line is indicating the cut-off for control cells. (D) The measurements were made in triplicate, and the values are expressed as the mean ± SD (*** p < 0.001 compared with the control group, ### p < 0.001 compared with the H2O2-treated group, $$$ p < 0.001 compared with the FO and H2O2-treated group).

Figure 3