. 2020 Aug 4;19:1102–1119. doi: 10.17179/excli2020-2376

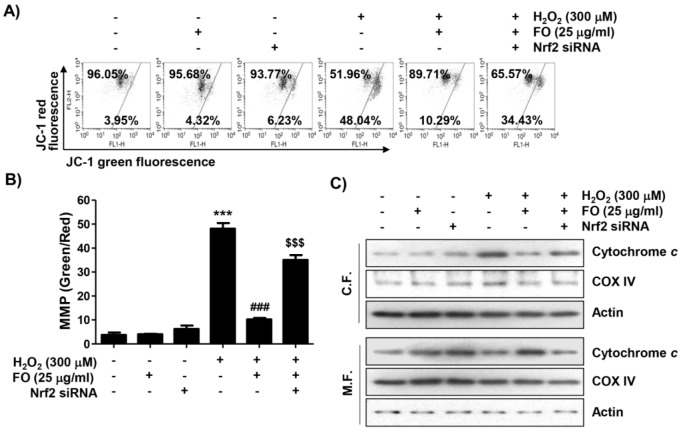
Figure 5. Attenuation of H2O2-induced mitochondrial dysfunction by FO in MC3T3-E1 cells. Cells transfected with or without Nrf2-siRNA were treated with 25 μg/ml FO for 1 h, then exposed to 300 μM H2O2 for 24 h. (A) The cells were collected and stained with 10 μM JC-1 for 20 min. JC-1 fluorescence intensity was detected for evaluation of the changes of MMP using flow cytometry. (B) The green (JC-1 monomers) and red (JC-1 aggregates) fluorescence ratio is indicating the proportion of mitochondrial depolarization. The data represent the mean ± SD of triplicate determinations (*** p < 0.001 compared with the control group, ### p < 0.001 compared with the H2O2-treated group, $$$ p < 0.001 compared with the FO and H2O2-treated group). (C) The expression of cytochrome c was analyzed by Western blot analysis using mitochondria and cytoplasmic fractions isolated from cells cultured under the same conditions. Actin and cytochrome oxidase subunit VI (COX IV) serve as protein loading controls for the cytosol and mitochondria, respectively.

Figure 5