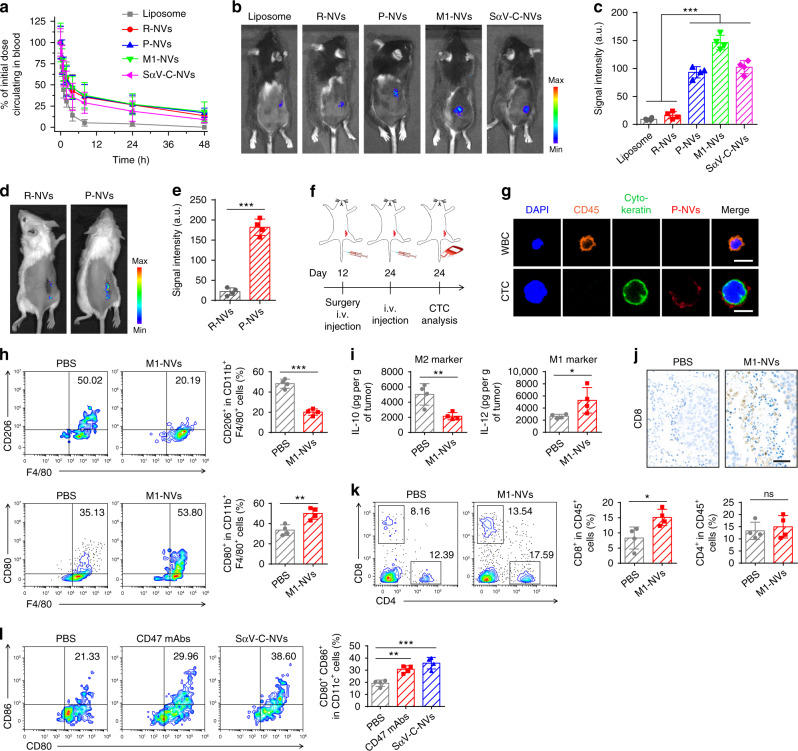
Fig. 2. In vivo characterization of P-NVs, M1-NVs, and SαV-C-NVs.
a, In vivo pharmacokinetic curves of liposomes, R-NVs, P-NVs, M1-NVs, and SαV-C-NVs. b, c In vivo fluorescence imaging (b) and corresponding fluorescence intensities (c) of the mice 2 h after i.v. injection of equivalent dose of fluorescence-labeled liposomes and multiple NVs. d, e In vivo fluorescence imaging of the mice (d) and corresponding fluorescence intensities (e) 2 h after i.v. injection of equivalent dose of fluorescently labeled R-NVs and P-NVs. f, Schematic showing the CTC analysis schedule in a recurrence mouse model after incomplete surgery. g Immunofluorescence images of single WBC and CTC captured from blood samples. Scale bar, 10 µm. h Flow cytometric analysis of M2-like macrophages (CD206+) and M1-like macrophages (CD80+) in tumor gating on F4/80+CD11b+CD45+ cells. i Secretion levels of IL-10 and IL-12 in different treatment groups. j Immunohistochemistry images of tumors showing CD8+ T cells in different treatment groups. Scale bar, 50 µm. k Flow cytometric analysis of CD8+ and CD4+ T cells in tumor gating on CD45+ cells. l, Flow cytometric analysis of CD80+CD86+ dendritic cells in tumor gating on CD45+CD11c+ cells. All data are presented as mean ± S.D. (n = 4). Statistical significance was calculated via ordinary one-way ANOVA with a Dunnett’s test c, l or unpaired two-tailed t test e, h, i, k. ns, no significance; *P < 0.05; **P < 0.01; ***P < 0.001.

