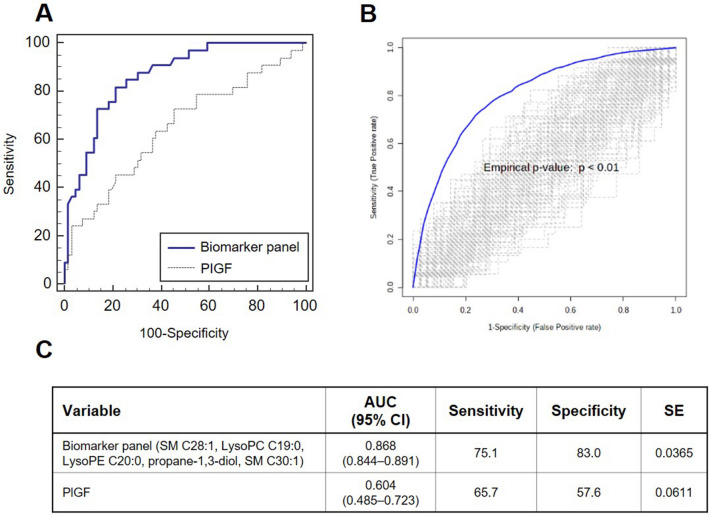
Figure 2.
Performance comparison of the metabolic biomarker panel and PlGF for discriminating preeclampsia from healthy controls in the mid-trimester cohort (A) Receiver operating characteristic (ROC) curve analysis. The biomarker panel of 5 discriminatory circulating metabolites were tested against PlGF levels in their ability to predict the development of PE. (B) Validation based on permutation test with 100 time-random sampling (C) Summarized features of ROC curve analysis of two models.

