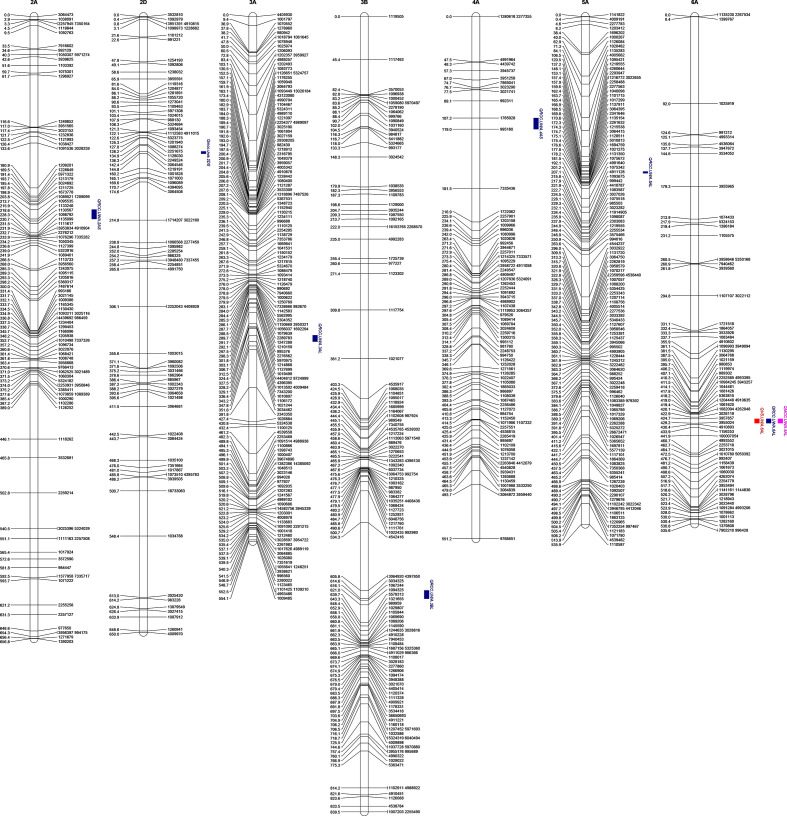
Figure 2.
Locations of detected QTL for metribuzin tolerance in Chuan Mai 25 × Ritchie RILs for visual score (VS), reduction in chlorophyll content (RCC), and mean value of chlorophyll content for metribuzin-treated plants (MCC). QTL are indicated by solid bars; blue bars indicate QTL for RCC, red bars indicate QTL for VS and pink bars indicate QTL for MCC. Map distances are indicated on the left in Kosambi centimorgans and DArT markers are indicated on the right of each chromosome.

