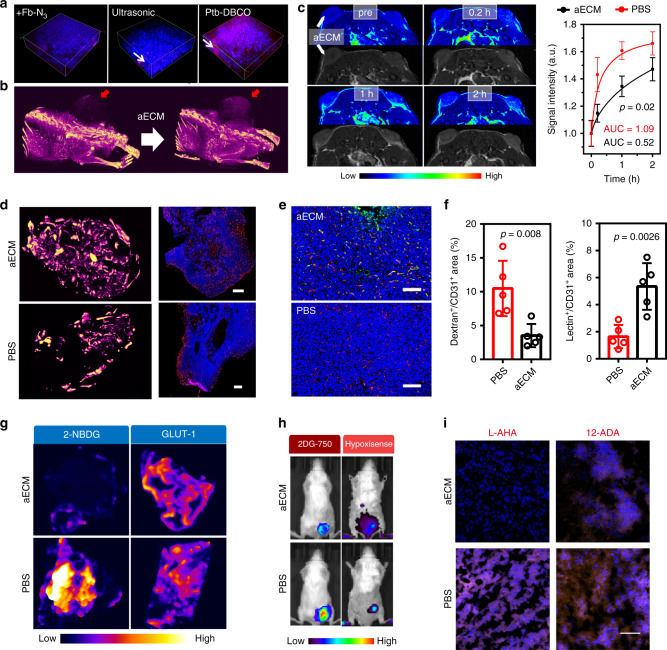
Fig. 5. In vivo biological activity of aECM.
a 3D tumor fluorescence imaging before and after aECM treatment (red: rhodamine B isothiocyanate-labeled fibrinogen; blue: Hochest 33342-strained cells). A representative image of three biological replicates is shown. White arrows indicate the aECM gelation. b µ-CT imaging of mice before and after treatment with diatrizoic acid-conjugated aECM. A representative image of three biological replicates is shown. Red arrows denote aECM gelation. c The T1-weighted MRI imaging was performed on bilateral tumor-bearing mice, and the representative images and quantitative results of tumors treatment with PBS (right) or aECM (left) are presented. A representative image of three biological replicates is shown. Arrows denote tumor positions. d μ-CT imaging for visualizing the three-dimensional structure of tumor vessels. Tumor sections were stained for CD31 (scale bar: 500 μm). A representative image of three biological replicates is shown. e CD31 and α-SMA immunostaining of tumor vessels. Tumor sections were stained for CD31 (red) and α-SMA (green) (scale bar: 200 μm). Five images per group were taken. f Quantitative analysis of dextran leakage and lectin perfusion of tumor vessels. The tumor sections were stained for CD31 (red). Dextran+ or lectin+ area is presented as a percentage per total sectional or CD31+ area (n = 5 fields). g The effect of aECM in suppressing glucose uptake and glycolysis. h In vivo fluorescence imaging of 2-DG 750 (100 μL) and HypoxiSense 680 (100 μL) for indicating the performances of aECM in affecting tumor glucose uptake and hypoxia. A representative image of three biological replicates is shown. i The effect of aECM in suppressing lipid and amino acid uptake. Tumors of 12-ADA- or L-AHA-treated mice were collected 24 h later, and stained with DBCO-Cy5 (n = 5 fields, scale bar: 100 μm). Significance between two groups (c, f) was calculated by using two-tailed Student’s t-test. The mean values and SD are presented.

