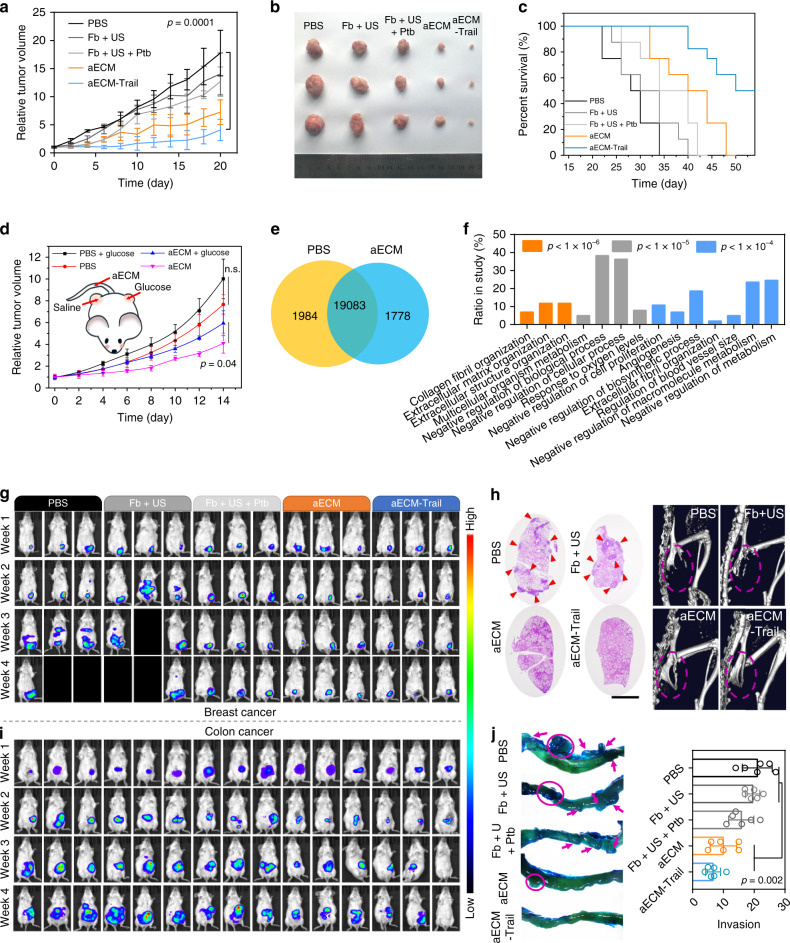
Fig. 6. In vivo therapeutic effect of aECM.
a Tumor volume curve of subcutaneous CT26 tumor-bearing mice after receiving various treatments. The treatment was started (day 0) when the tumor volume reached to 100 mm3. Five biological replicates are shown. b Typical images of subcutaneous tumors collected after various treatments as indicated. c The survival curve of subcutaneous CT26 tumor-bearing mice after receiving various treatments. Eight biological replicates are shown. d Intratumoral injection of glucose for rescuing tumor cells from aECM-induced cell death. Four biological replicates are shown. aECM gelation was induced in tumors on both sides of the mice. e Venn diagram for the identified genes that between tumors of PBS- or aECM-treated mice (n = 3 for each group). f Differentially expressed genes were subjected to gene ontology (GO) enrichment analysis. g In vivo bioluminescence imaging of orthotopic breast cancer-bearing mice after various treatments. Three representative images of six biological replicates are shown. Black boxes denote dying mice. h The anti-metastasis effect of aECM treatment. H&E staining images of lungs from 4T1 tumor-bearing mice after treated with various agents (scale bar: 300 μm). μ-CT images for visualizing the bone metastasis of 4T1 tumor-bearing mice. A representative image of three biological replicates is shown. Arrows denote pulmonary metastasis. Circles mark broken bones. i In vivo bioluminescence imaging of orthotopic CT26luc colon cancer-bearing mice after various treatments. Three representative images of six biological replicates are shown. j Representative images of intestinal tracts from colon tumor-bearing mice after various treatments. Arrows indicate the invasive tumors. Six biological replicates are shown. Significance between every two groups was calculated by using one-way ANOVA with Tukey post hoc analysis (a, j) or (d) two-tailed Student’s t-test. The BH FDR p value (f) was used. The mean values and SD are presented.

