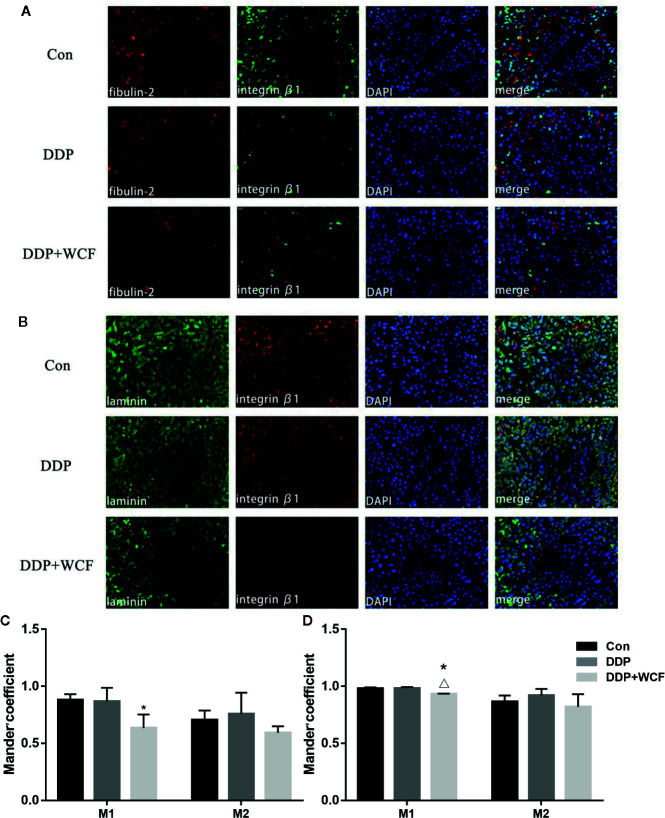
Figure 6.
WCF combined with DDP affected expression and colocalization of Integrin β1and its ligand proteins(fibulin-2/laminin). (A) Immunofluorescence labeling of fibulin-2 and Integrin β1 in tumor tissue slices. (B) Immunofluorescence labeling of laminin and Integrin β1 in tumor tissue slices. (C) Mean fluorescence intensity as well as quantitative colocalization analysis of fibulin-2 and Integrin β1. (D) Mean fluorescence intensity as well as quantitative colocalization analysis of laminin and Integrin β1. Mean fluorescence intensity and Manders’coefficient were calculated by Image J. Statistical difference was analyzed by ANOVA, *P < 0.05 compared to control, △ P < 00.05 compared to DDP.

