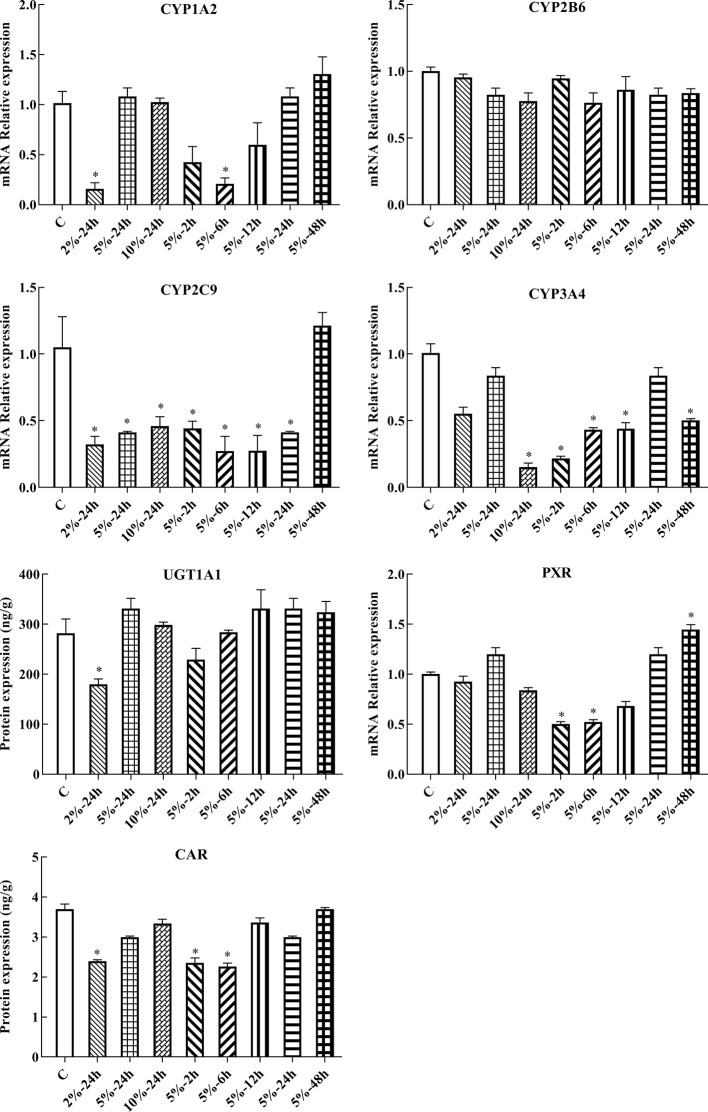
Figure 5.
mRNA expression of Cyp1A2, Cyp2B6, Cyp2C9, Cyp3A4, Ugt1A1, Pxr, and Car in HepG2 cells. C: control group, HepG2 cells were cultured in a normoxic humidified incubator. HepG2 cells were exposure to 2% O2 for 24 h (2%-24 h), 5% O2 for 24 h (5%-24 h), 10% O2 for 24 h (10%-24 h), 5% O2 for 2 h (5%-2 h), 5% O2 for 6 h (5%-6 h), 5% O2 for 12 h (5%-12 h), 5% O2 for 24 h (5%-24 h), and 5% O2 for 48 h (5%-48 h). The data were analyzed using a one-way analysis of variance (ANOVA), and the differences between the means of two groups were compared using LSD tests. * indicates the significance of experimental groups, compared with that of the control. Values are expressed as Mean ± SEM (n = 3). Levels are considered significant at * p < 0.05.

