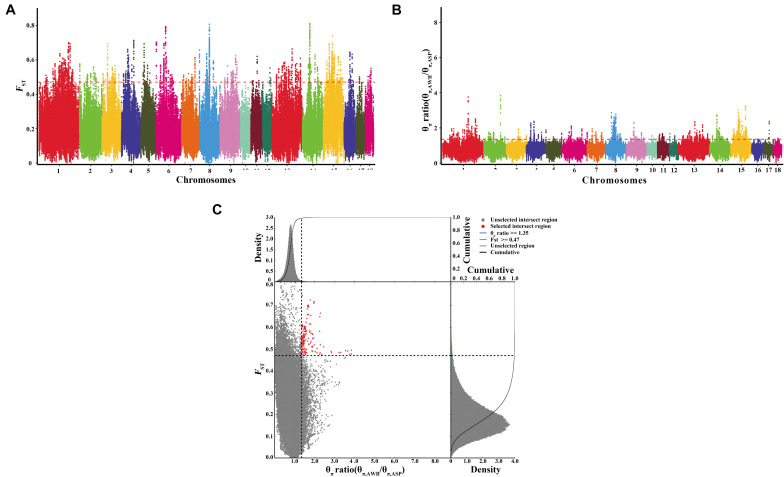
FIGURE 4.
Identification of genomic regions with strong selective sweep signals in Anqing six-end-white pig population. Distribution of θπ ratio (θπ, AWB/θπ, ASP) and FST, which are calculated in 100-kb windows sliding in 10-kb steps. (A) Distribution of FST values among autosome chromosomes. The red line represents the 0.01 level. (B) Distribution of θπ ratio among autosomal chromosomes. The red line represents the 0.01 level. (C) The final selection regions based on two statistics. Points located to the right of the vertical dashed lines (corresponding to 1% right tails of the empirical θπ ratio distribution, where θπ ratio is 1.352358) and above the horizontal dashed line (1% above tail of the empirical FST distribution, where FST is 0.470988) were identified as selected regions for Anqing six-end-white pig (ASP) (red points).

