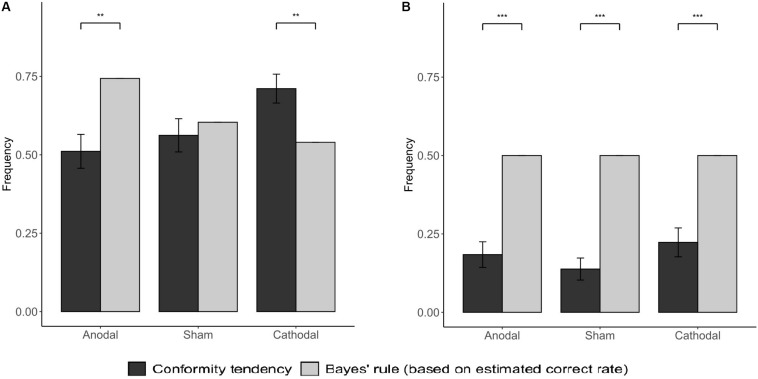
FIGURE 7.
Social conformity tendency in subjects and from BNE. The gray bars indicate the Bayesian Nash Equilibrium (based on estimated correct rate). (A) was for NPI = −3; (B) was for NPI = −1. Error bars indicate ± 1 SEM. Asterisks indicate statistically significant differences between the BNE and the actual probability of the subjects’ conformity behavior. *P < 0.05; **P < 0.01; ***P < 0.001.

