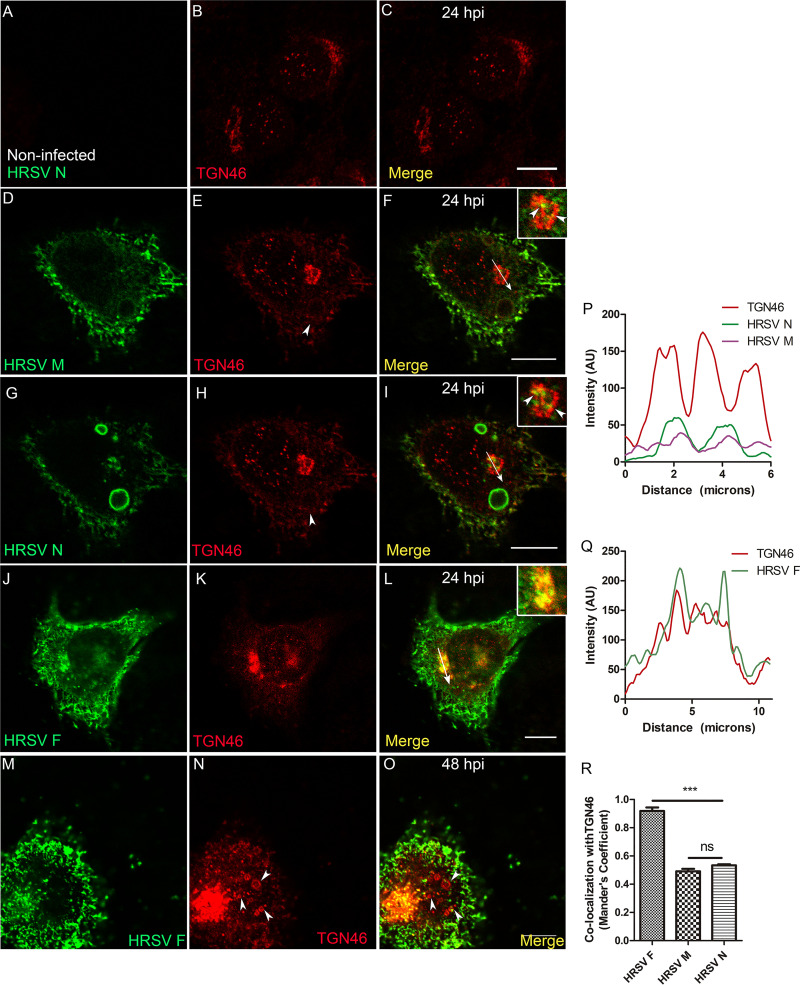
FIG 3.
HRSV M and N proteins colocalize with the trans-Golgi network marker TGN46. (A to C) Negative control showing staining for TGN46 in noninfected cells. (D and E) Separate channels of HRSV M protein and TGN46. (F) Colocalization of HRSV M protein and TGN46, with arrowheads indicating the points of colocalization and the arrow where the plot profile was traced. (G and H) Separate channels of HRSV N protein and TGN46. (I) The same cell as in panel F, showing colocalization of HRSV N protein with TGN46, with an arrow indicating where the plot profile was traced and arrowheads indicating points of colocalization. (J and K) Separate channels of HRSV F protein and TGN46. (L) Colocalization of HRSV F protein and TGN46 at 24 hpi. (M and N) Separate channels of HRSV F protein and TGN46, with arrows pointing to the ring-shaped structures labeled for TGN46. (O) Colocalization of HRSV F and TGN46. (P) Plot profile of panels D to I. (Q) Plot profile corresponding to the arrow traced in panel L. (R) Mander’s colocalization between HRSV F, M, and N with TGN46 at 24 hpi. Panels A to O represent a single focal plane of at least three independent experiments taken with a Leica SP5 confocal microscope. Magnification, ×63. The colocalization P value was determined using ANOVA one-way Tukey’s multiple-comparison test. *, P < 0.05; **, P < 0.01; ***, P < 0.001; ns, nonsignificant. All the scale bars = 10 μm.

