FIG 5.
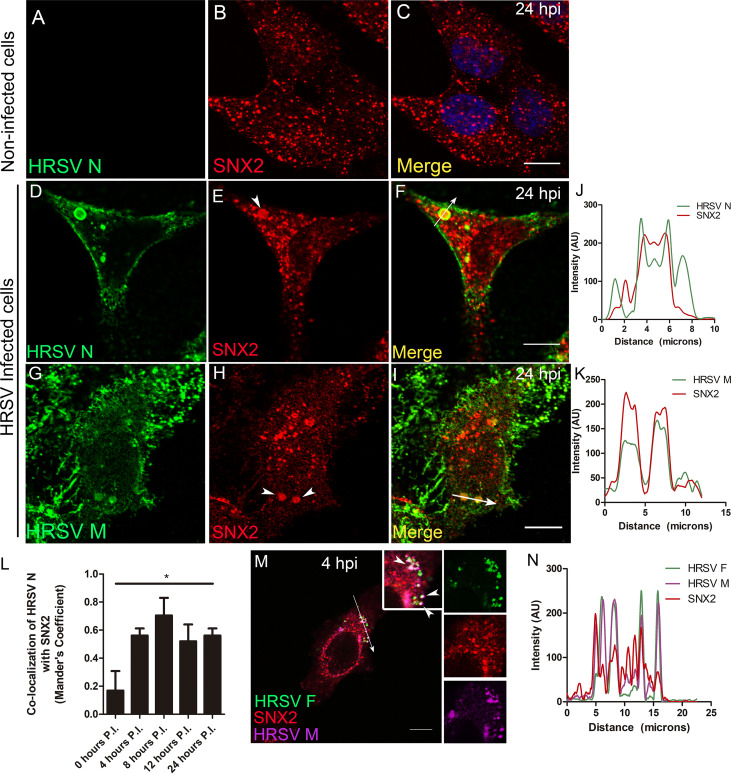
HRSV M and N proteins colocalize with the early endosome marker SNX2. (A to C) Staining for SNX2 in noninfected HEp-2 cells. (D and E) Separate channels for N protein and SNX2. (F) Colocalization of HRSV N protein and SNX2. (G and H) Separate channels of HRSV M and SNX2, with arrowheads indicating points of accumulation of SNX2. (I) Colocalization of HRSV M protein and SNX2. (J) Plot profile based on the arrow traced on panel F. (K) Plot profile traced on panel I. Images in panels A to I were taken at 24 hours postinfection. (L) Mander’s coefficient of colocalization of HRSV N with SNX2 over time postinfection; the asterisk indicates that the colocalization was significantly higher at 8 hpi than at all other time points (t test was used to compare times pairwise). (M) Triple colocalization of HRSV F and M proteins with SNX2 (arrowheads) at 4 hours postinfection. (N) Plot profile of the arrow traced on panel M. These figures are representative of at least three independent experiments and represent a single focal plane, taken with a Leica SP5 confocal microscope. The graph in panel L is representative of Mander’s colocalization of N with SNX2 from Z-stack imaging from at least three independent experiments. The P value was determined using ANOVA one-way Tukey’s multiple-comparison test. *, P < 0.05; **, P < 0.01; ***, P < 0.001. All the scale bars = 10 μm.

