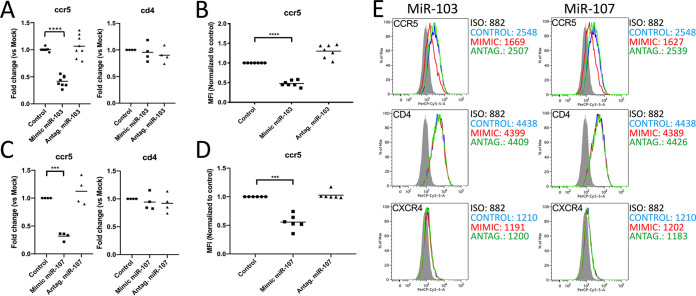
FIG 2.
Effect of transfected miR-103 or miR-107 mimics, or antagomirs, on CCR5 expression in MDMs. MDMs from 4 to 8 blood donors were transfected with either the indicated controls, mimics, or antagomirs and processed accordingly. (A) CCR5 and CD4 mRNA levels were quantified by real-time qPCR in control, miR-103 mimic-transfected, or miR-103 antagomir-transfected MDMs and compared to those in control-transfected cells. Bars are the mean fold changes compared to the control (n = 4 to 8 blood donors; Wilcoxon matched-pairs signed-rank test). (B) Surface CCR5 was measured by flow cytometry in control, miR-103 mimic-transfected, or miR-103 antagomir-transfected MDMs, and the geometric mean fluorescence intensity (MFI) was calculated relative to control-transfected cells. Bars are the mean relative MFIs (n = 7 blood donors; Wilcoxon matched-pairs signed-rank test). (C) CCR5 and CD4 mRNA levels were quantified by real-time qPCR in control, miR-107 mimic-transfected, or miR-107 antagomir-transfected MDMs and compared to those in control-transfected cells. Bars are the mean fold changes compared to the control (n = 4 blood donors; Wilcoxon matched-pairs signed-rank test). (D) Surface CCR5 was measured by flow cytometry in control-, miR-107 mimic-, or miR-107 antagomir-transfected MDMs, and the MFI was calculated relative to control-transfected cells. Bars are the mean relative MFIs (n = 6 blood donors; Wilcoxon matched-pairs signed-rank test). (E) Representative flow cytometry data for MDMs from one blood donor shown in panels B and D. Additional surface expression levels (MFIs) for CD4 and CXCR4 are also shown. ISO, isotype control.

