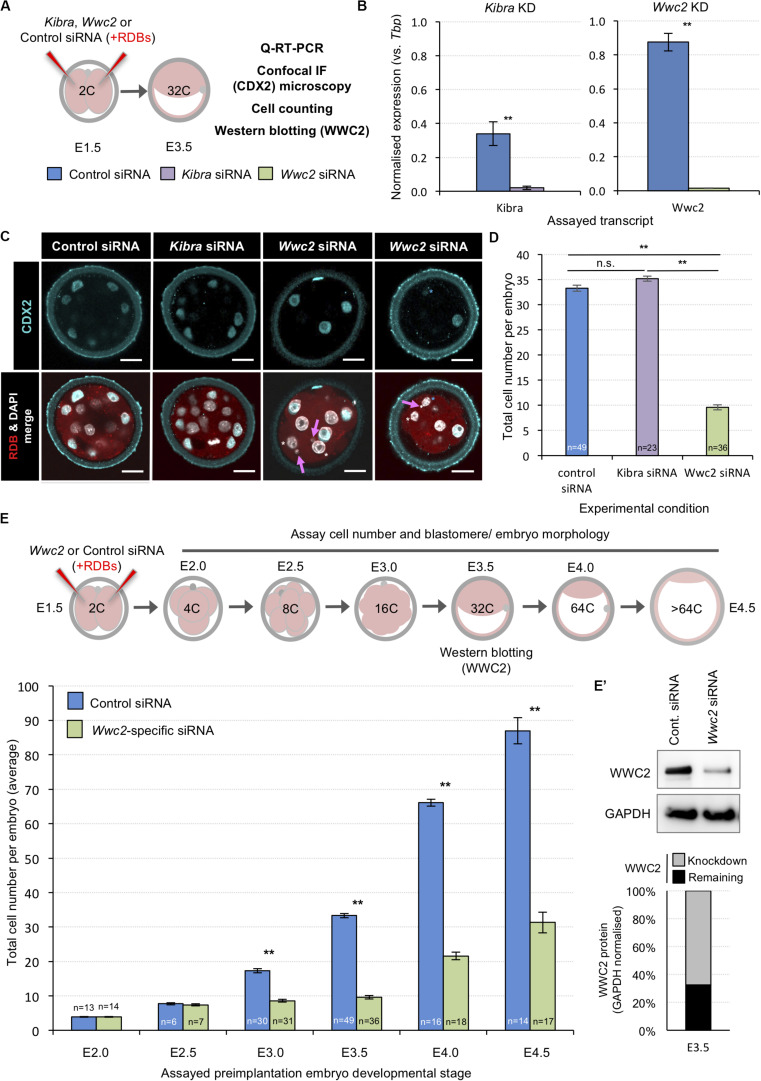
FIGURE 1.
siRNA mediated global Wwc2 knockdown causes persistent preimplantation embryo cell number deficits from the 8-cell stage. (A) Experimental design (relating to panels B–D, E’); non-specific control (color coded blue), Kibra-specific (purple) or Wwc2-specific (green) siRNA was co-microinjected with rhodamine dextran conjugated beads (RDBs – injection marker) into both blastomeres of 2-cell stage (E1.5) mouse embryos. Microinjected embryos were in vitro cultured to the 32-cell stage (E3.5) and either processed for Q-RT-PCR, confocal immuno-fluorescent staining microscopy (assaying CDX2 expression and including a total cell assay count) or western blotting to assay WWC2 protein expression. (B) Q-RT-PCR analysis of global siRNA mediated knockdown of endogenous Kibra (left) and Wwc2 (right) mRNA at the 32-cell stage (error bars denote s.e.m. of triplicate measurements, n = 3, **p < 0.005). (C) Exemplar single z-stack micrographs of control, Kibra-specific and Wwc2-specific siRNA microinjected 2-cell stage embryos cultured to the 32-cell stage and immuno-fluorescently stained for CDX2 expression (CDX2 – cyan, RDBs –red and DNA/DAPI – white; merged images in lower panels). Magenta arrows denote micronuclei specifically observed in the Wwc2-siRNA microinjected group and blue and white asterisks outer cells with reduced or absent CDX2 protein expression, respectively; scale bar = 20μm. (D) Average total cell number in control, Kibra-specific or Wwc2-specific siRNA microinjected 2-cell embryos cultured to the 32-cell stage. (E) Similar analysis to panel (D), whereby control and Wwc2-specific siRNA microinjected 2-cell stage embryos were cultured to the indicated developmental stages and the average total cell number calculated (according to the stated experimental schema – upper panel). In panels (D,E) errors represent s.e.m. and 2-tailed student t-test derived statistical significance between control, Kibra KD and Wwc2 KD groups indicated (**p < 0.005); the number of embryos in each group is also indicated. Note, the 32-cell/E3.5 data in both panels is derived from the same analysis. (E’) Western blot confirming robust WWC2 protein expression knockdown in 2-cell stage Wwc2-specific siRNA microinjected embryos cultured to the 32-cell stage versus the control group. Quantification of the representative western blot (upper panels) is provided in chart form (lower panel) detailing the extent of normalized WWC2 protein knockdown observed. Supplementary Tables ST1–ST6 summarize statistical analyses and individual embryo data. Note, additional data describing frequencies of observable cell morphological/division defects, obtained from this same dataset are also presented in Figure 2 and Supplementary Figure S4.

