FIGURE 3.
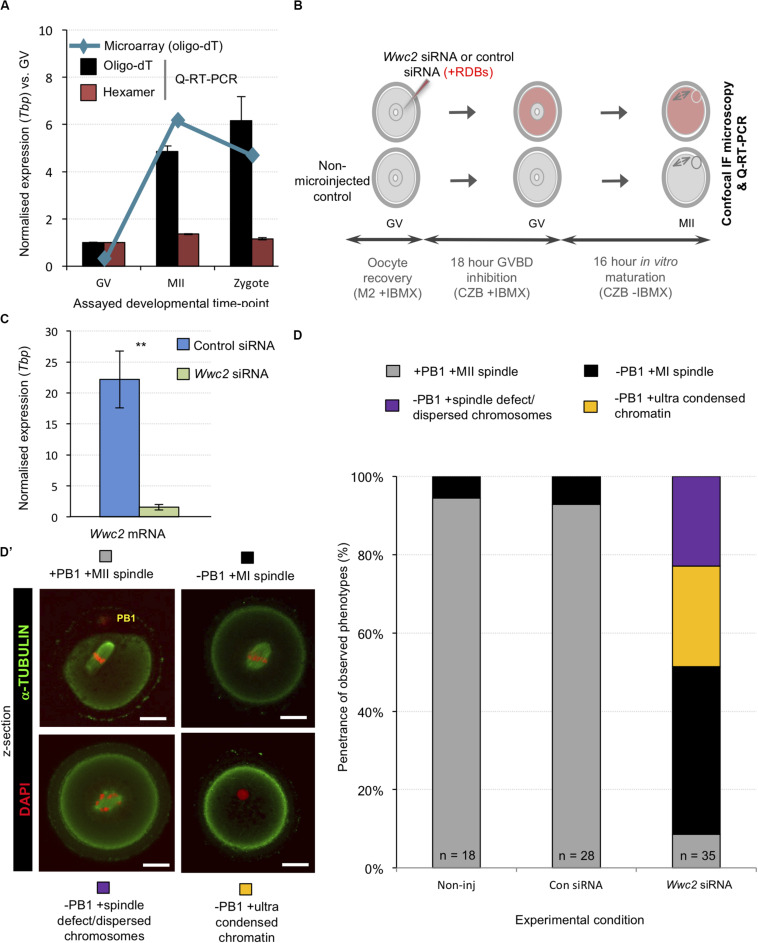
Wwc2 mRNA is required for mouse oocyte meiotic maturation. (A) Published microarray (Wang et al., 2004, blue line) and generated Q-RT-PCR (bar charts) normalized Wwc2 mRNA expression in germinal vesicle and metaphase II arrested oocytes (GV and MII) and fertilized zygotes (Tbp normalized expression, relative to GV stage). Note, microarray data derived from oligo-dT primed reverse transcription and Q-RT-PCR from both oligo-dT (black bars) and random hexamer priming (red bars); error bars represent s.e.m. and n = 3. (B) Experimental schema of Wwc2 knockdown in GV oocytes by microinjected Wwc2 siRNA (plus control siRNA and non-microinjected controls), 18 h incubation in IMBX containing media (preventing GVBD), 16 h in vitro oocyte maturation (IVM – minus IMBX) and confocal microscopy or Q-RT-PCR analysis; co-microinjected RDBs used as injection control marker. (C) Q-RT-PCR data of normalized (against Tbp) Wwc2 mRNA levels in control and Wwc2 siRNA microinjected GV oocytes after IVM to the MII equivalent stage (error bars represent s.e.m., n = 3 and **p < 0.005 in 2-tailed student t-test). (D) Charts detailing successful IVM frequencies of control non-microinjected (Non-inj), microinjected control siRNA (Con siRNA) and microinjected Wwc2 siRNA GV oocytes, to the MII stage or indicated phenotypic stages. (D’) Examples of successfully matured MII oocytes (note, extruded first polar body/PB1) and the observed and quantified categorized phenotypes shown as confocal z-section micrographs (α-Tubulin in green and DAPI DNA pseudo-colored red; scale bar = 20 μm). Supplementary Figure S5 details the complete confocal z-series of the illustrative oocyte examples shown in panel (D’). Supplementary Table ST14 summarize statistical analysis and individual oocyte data used to generate the figure.

