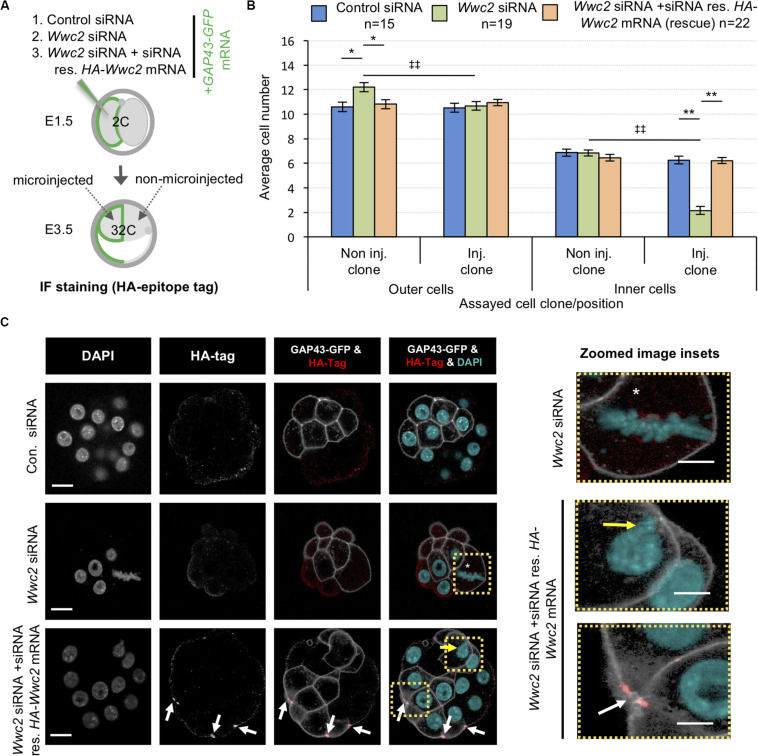
FIGURE 6.
Expression of siRNA resistant HA-Wwc2 mRNA rescues Wwc2 siRNA induced embryo cell number/division phenotypes. (A) Experimental strategy for potential phenotypic rescue of clonal Wwc2 KD by comparing co-microinjection (in one blastomere of 2-cell stage embryos) of GAP43-GFP mRNA (stable plasma membrane fluorescent microinjection marker to distinguish from the non-microinjected clone) with control siRNA, Wwc2 siRNA or Wwc2 siRNA + recombinant HA-Wwc2 mRNA (containing N-terminal HA-epitope tag and point mutants conferring siRNA resistance – see Supplementary Figure S8) and assaying total, outer and inner-cell number at the 32-cell blastocyst stage. (B) Average clonal contribution (microinjected/Inj. versus non-microinjected/Non inj.) of outer and ICM/inner cells in control siRNA (blue bars), Wwc2 siRNA (green bars) and Wwc2 siRNA + HA-Wwc2 mRNA (rescue – orange bars) microinjected embryos; errors represent s.e.m. and 2-tailed student t-test derived statistical significance between the experimental groups (asterisks), or clones within a group (double crosses) highlighted with statistical confidence intervals of p < 0.05 and p < 0.005 (denoted by one or two significance markers, respectively). The number of embryos in each experimental group is provided. (C) Exemplar confocal z-section micrographs of 32-cell blastocyst stage embryos, derived from the indicated microinjection groups, IF stained to detect HA-epitope tag expression (individual greyscale channels, plus merged images were the anti-HA channel is red and the DAPI cyan). Within the microinjected clone of the Wwc2 siRNA treated embryo, the white asterisk denotes characteristic abnormal mitosis, whilst in the microinjected clone of the Wwc2 siRNA + HA-Wwc2 rescue embryo example the white arrows indicate anti-HA epitope tag IF signal associated with mid-bodies and the yellow arrow the single incidence of any persisting nuclear abnormality (see also indicated zoomed images - right); scale bar = 20μm. Supplementary Table ST24 summarise statistical analysis and individual embryo data used to generate the figure.

