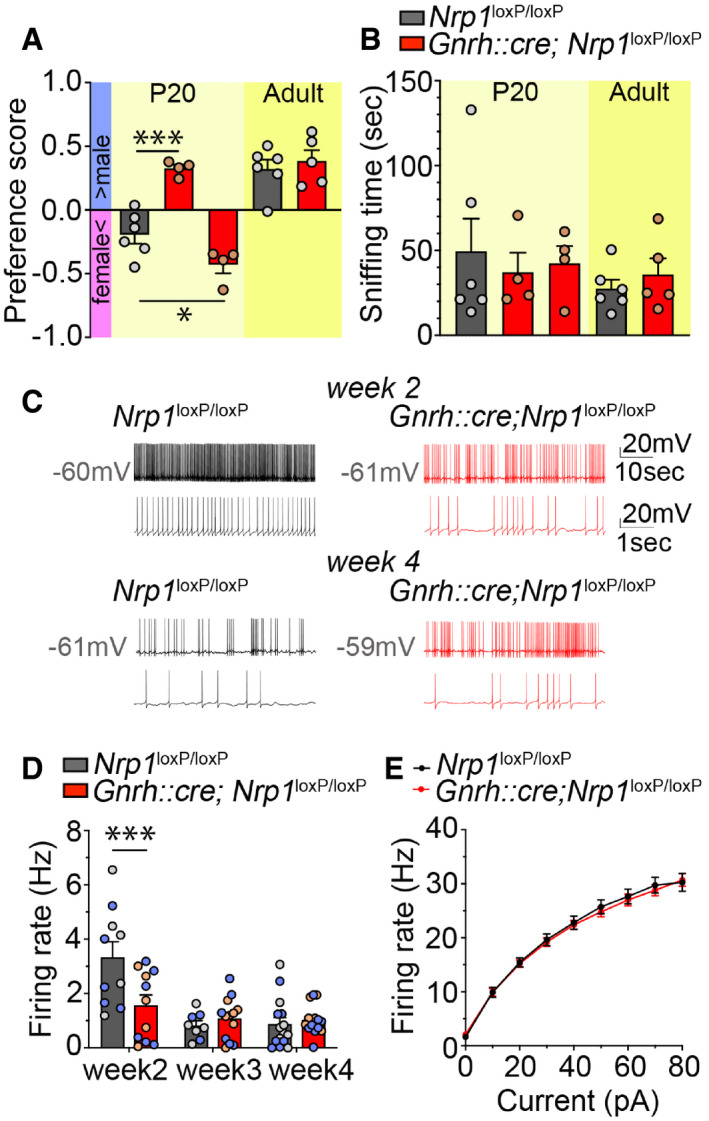
Olfactory sex preference test in P20 (left panel) and adult (right panel) control and mutant female mice. Half of the mutant females at P20 showed a preference for males, similar to adults of both genotypes, whereas the other half showed an even more pronounced preference for females than their control littermates at P20. One‐way ANOVA, Fisher's LSD multiple‐comparison test for P20 mice and unpaired t‐test for adult mice; n = 4–6 from at least 3 litters.
Time spent sniffing after the introduction of both male and female odors into the cage of control and mutant littermates. One‐way ANOVA, Fisher's LSD multiple‐comparison test for P20 mice and unpaired t‐test for adult mice; n = 4–6 from at least 3 litters.
Representative traces of spontaneous firing in GnRH neurons from control (left, black) and mutant (right, red) animals at Week 2 (upper panels) and Week 4 (lower panels); lower traces show an enlargement of the upper trace.
Average spontaneous firing frequency in GnRH neurons from control and mutant mice at Weeks 2, 3, and 4. Individual males and females used for this analysis are represented by blue and gray/light‐red dots, respectively. Two‐way ANOVA, Fisher's LSD multiple‐comparison test, n = 8–14 neurons from at least three animals from different litters. Note that individual neurons from male (n = 3–8) and female mice (n = 5–8) used for this analysis are represented by blue and gray dots, respectively.
Quantification of evoked firing in GnRH neurons from control and mutant mice in response to current steps. Two‐way repeated‐measures ANOVA, n = 10–11 neurons from at least three mice from different litters.
Data information: Bar graphs show individual values and means ± SEM. *
< 0.001.