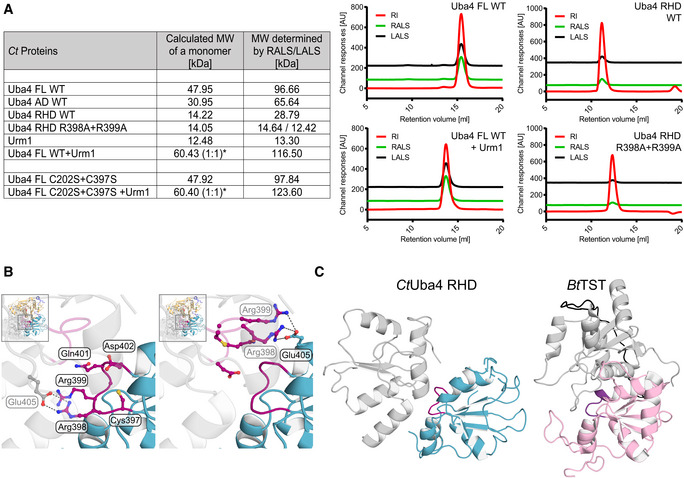
Figure EV1. CtUba4 FL, AD, and RHD are dimers in solutions.

- Tabular summary of static light‐scattering (SLS) experiments. Calculated molecular weight (MW) of the indicated proteins or protein complexes is compared to experimentally determined MWs. *For the Uba4–Urm1 complex, the MW is calculated for a 1:1 protein ratio. Selected graphs from SLS measurements are presented (right). Profiles of refractive index (RI, red), right‐angle light scattering (RALS, green), and low‐angle light scattering (LALS, black) are shown. MW: molecular weight; FL: full length; WT: wild type, AU: arbitrary units.
- Close‐up view of the CtUba4 RHD active loop (purple) with ball‐and-stick representation of amino acids. The second RHD molecule (grey, transparent) is shown to visualize the dimer interface. Hydrogen bonds are indicated as dashed lines.
- Structural comparison of the RHD active loop localization in relation to the dimeric interface of the domain in CtUba4 (cyan) and Bos taurus thiosulfate sulfurtransferase (BtTST; pink; PDB ID 1RHD).
