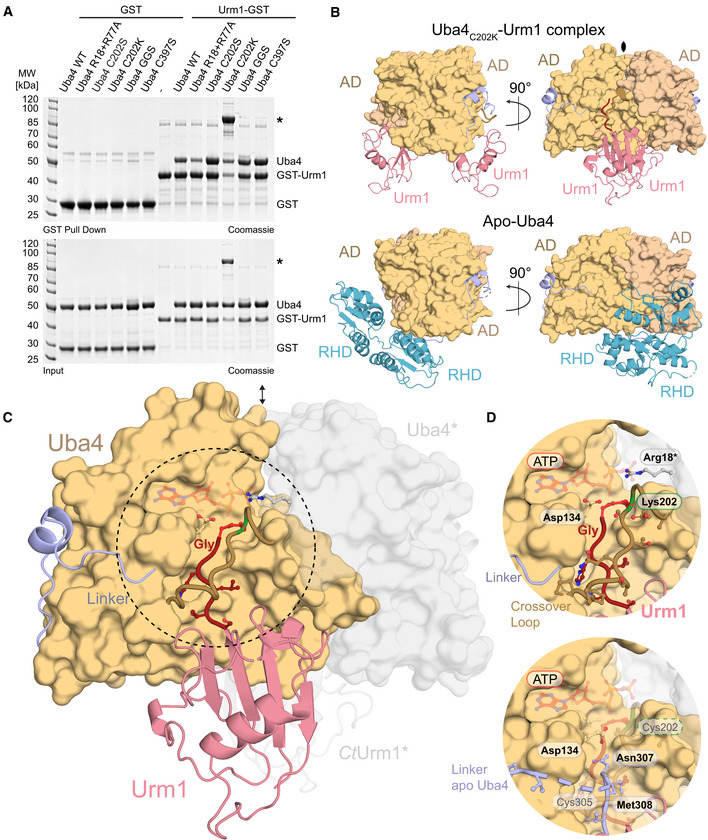
Figure 3. Crystal structure of the Uba4C202K‐Urm1 complex at 3.1 Å resolution.

- Interaction analysis of WT and mutated CtUba4 with GST‐CtUrm1 by GST pull‐down in the presence of 1 mM ATP. CtUba4C202K covalently linked to GST‐CtUrm1 is marked by an asterisk.
- Comparison of the structures of the CtUba4C202K‐CtUrm1 complex and apo CtUba4 focusing on the arrangement of Urm1 and RHD in relation to the AD dimers. The symmetry operator of the crystallographic twofold axis is indicated.
- Overall structure of the CtUba4C202K‐CtUrm1 complex. The AD dimer is shown as surface representation, and the Uba4 linker (light blue), crossover loop (light brown), and Urm1 (salmon) are shown as cartoon. The C‐terminus of Urm1 (dark red), Lys202 (green), and the formed covalent peptide bond between the two components (red) are highlighted. The ATP molecule (transparent red) is positioned in the nucleotide‐binding site based on the ATP‐bound EcMoeB‐MoaD complex (PDB ID: 1JWA). Uba4 and Urm1 molecules from the adjacent asymmetric unit which form the dimer are shown in transparent grey.
- Close‐up view of the CtUba4 active site and the CtUrm1 C‐terminus (top). A superposition of the linker from apo CtUba4 structure is shown (bottom). Crucial residues are shown as ball‐and-stick model, and the tentative positions of Cys202 Cys305 are indicated.
