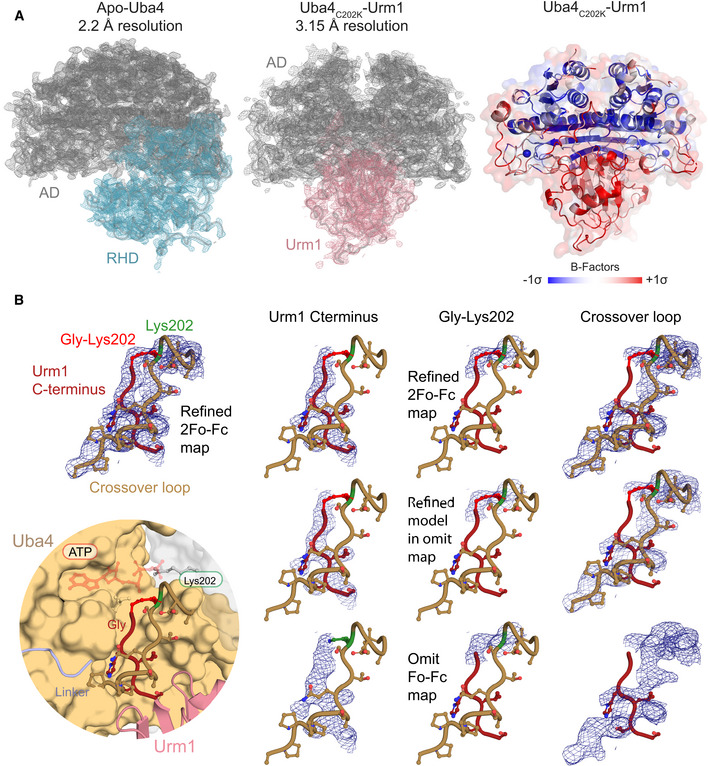
Figure EV3. Structural analyses of the Uba4–Urm1 complex.

- Refined 2Fo‐Fc electron‐density maps contoured at 1.0σ for apo CtUba4 (left) and CtUrm1‐bound CtUba4 (middle). Densities of ADs (grey), RHD (cyan), and Urm1 (salmon) are labeled. Cartoon model with transparent surface representation of the Uba4C202K‐Urm1 complex structure highlighting the detailed B‐factor distribution (right).
- Close‐up of the active site of Uba4 linked to the C‐terminus of Urm1 (bottom left) showing refined densities of the Urm1 C‐terminus (red), the crossover loop of Uba4 (brown), and Lys202 (green) at 1σ (top left). Comparison between refined 2Fo‐Fc maps of individual regions with F o‐F c omit maps after omitting the respective parts of the model.
