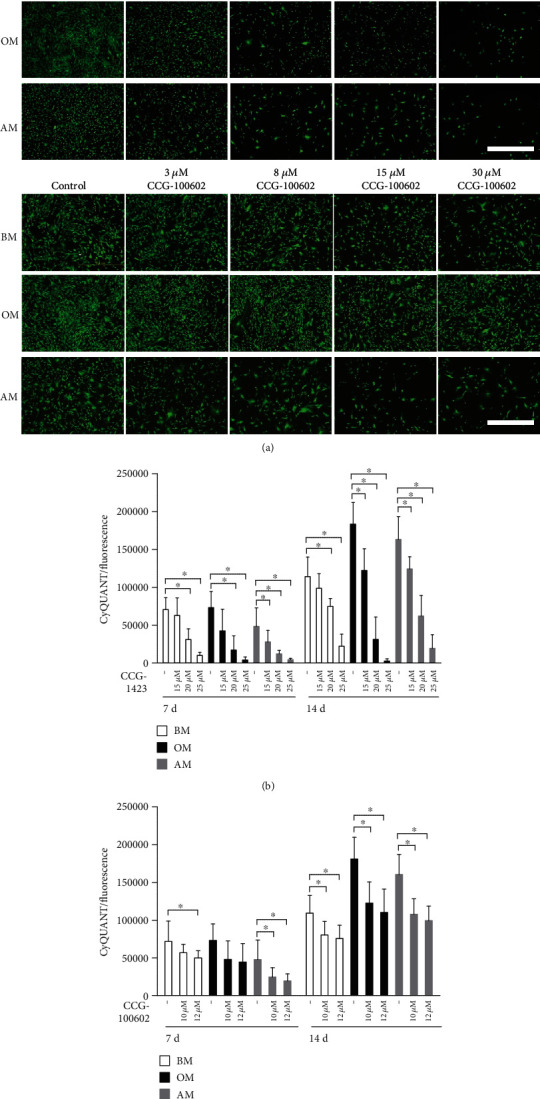
Figure 1.

Effect of MRTF-A inhibition on viability and proliferation of hASCs. (a) Representative fluorescence images of LIVE/DEAD-stained hASCs. hASCs were cultured 7 d in BM, OM, or AM supplemented with 15, 20, 25, or 30 μM CCG-1423 or 3, 8, 15, or 30 μM CCG-100602 inhibitor, after which LIVE/DEAD analysis was performed. Green dye represents living cells (Alexa 488 filter), and a negligible number of dead cells are stained with red dye (Alexa 546). Scale bar 1.0 mm, same scale in every image. (b, c) Proliferation of hASCs at 7 and 14 d was analyzed with the CyQUANT method. The hASCs were cultured in BM, OM, or AM supplemented with 15, 20, or 25 μM CCG-1423 inhibitor (b) or 10 or 12 μM CCG-100602 inhibitor (c). N = 12, independent biological replicates from 4 donors. 5% significance level was used in the statistical analysis, and the comparisons were made within a culture condition by comparing the inhibitor concentrations with the untreated medium control. BM: basic medium; OM: osteogenic medium; AM: adipogenic medium.
